| Neurocrine Bioscienc (NBIX) | |||
|---|---|---|---|
| 137.76 -1.21 (-0.87%) | 04-25 16:00 | ||
| Open: | 139.37 | Pre. Close: | 138.97 |
| High: | 139.37 | Low: | 136.06 |
| Volume: | 699,886 | Market Cap: | 13,708(M) |
| Stock Technical Analysis | |
|---|---|
| Overall: |  |
| Target: | Six months: 165.16 One year: 173.30 |
| Support: | Support1: 130.13 Support2: 108.27 |
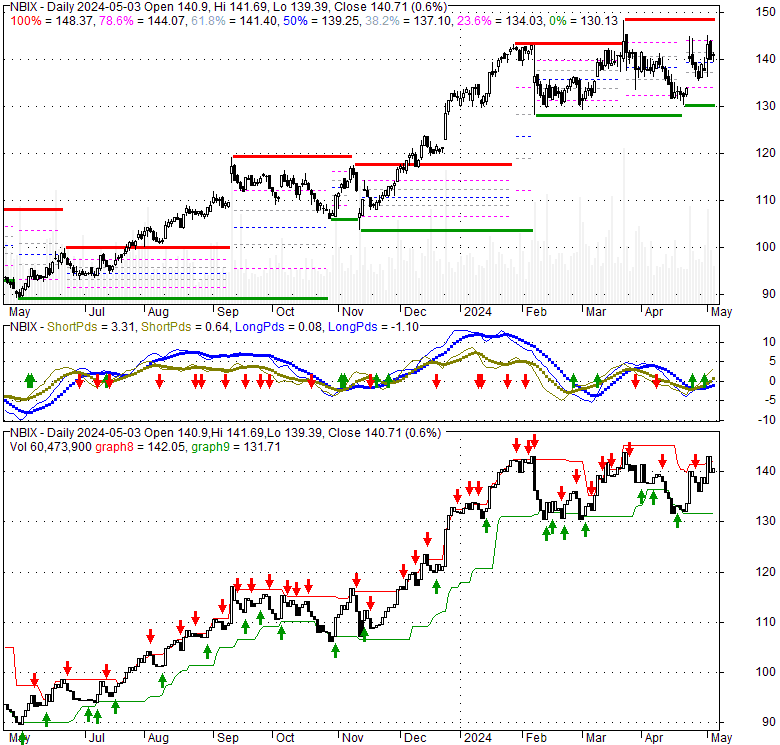
| Resistance: | Resistance1: 141.40 Resistance2: 148.37 |
| Pivot: | 135.93 |
| Moving Averages: | MA(5): 136.50 MA(20): 136.56 MA(100): 133.78 MA(250): 116.05 |
| MACD: | MACD(12,26): -0.32 Signal(12,26,9): -0.62 |
| %K %D: | %K(14,3): 59.25 %D(3): 49.96 |
| RSI: | RSI(14): 52.71 |
| 52-Week: | High: 148.37 Low: 89.04 Change(%): 35.2 |
| Average Vol(K): | 3-Month: 895 10-Days: 776 |
| Prices Prediction (Update @5:00pm) | ||
|---|---|---|
| If tomorrow: | Open lower | Open higher |
| High: | 139.43 - 140.367 | 140.367 - 141.144 |
| Low: | 134.264 - 135.177 | 135.177 - 135.933 |
| Close: | 136.414 - 137.905 | 137.905 - 139.142 |
| Price, MAs and Bollinger Bands |
|---|
| Price has closed above its short-term moving average. Short-term moving average is currently below mid-term; and above long-term moving average. From the relationship between price and moving averages: This stock is NEUTRAL in short-term; and NEUTRAL in mid-long term.[ NBIX ] has closed below upper band by 34.6%. Bollinger Bands are 3.4% narrower than normal. The current width of the bands does not suggest anything about the future direction or movement of prices. |
| Company profile |
|---|
| Neurocrine Biosciences, Inc. discovers, develops, and markets pharmaceuticals for neurological, endocrine, and psychiatric disorders. The company's portfolio includes treatments for tardive dyskinesia, Parkinson's disease, endometriosis, and uterine fibroids, as well as clinical programs in various therapeutic areas. Its lead asset is INGREZZA, a VMAT2 inhibitor for the treatment of tardive dyskinesia. The company's commercial products include ONGENTYS, a catechol-O-methyltransferase inhibitor used as an adjunct therapy to levodopa/DOPA decarboxylase inhibitors for patients with Parkinson's disease; ORILISSA for the management of moderate to severe endometriosis pain in women; and ORIAHNN, a non-surgical oral medication option for the management of heavy menstrual bleeding associated with uterine fibroids in pre-menopausal women. Its product candidates in clinical development include NBI-921352 for treating pediatric patients, as well as adult focal epilepsy indications; and NBI-827104 to treat rare pediatric epilepsy and essential tremor. The company's products in clinical development also comprise NBI-1065845 for the treatment of major depressive disorder; NBI-1065846 for treating anhedonia in major depressive disorder; and NBI-118568 for the treatment of schizophrenia. It has license and collaboration agreements with Heptares Therapeutics Limited; Takeda Pharmaceutical Company Limited; Idorsia Pharmaceuticals Ltd; Xenon Pharmaceuticals Inc.; Voyager Therapeutics, Inc.; BIAL Portela & Ca, S.A.; Mitsubishi Tanabe Pharma Corporation; and AbbVie Inc. Neurocrine Biosciences, Inc. was incorporated in 1992 and is headquartered in San Diego, California. |
| Stock chart |
|---|
 |
| Financial Analysis | |
|---|---|
| Price to Book Value: | Outperform |
| P/BV, a ratio used to compare book value to its current market price, to gauge whether a stock is valued properly. | |
| Price to Earnings: | Outperform |
| PE, the ratio for valuing a company that measures its current share price relative to its earnings per share (EPS). | |
| Discounted cash flow: | Outperform |
| DCF, a valuation method used to estimate the value of an investment based on its expected future cash flows. | |
| Return on Assets: | Outperform |
| ROA, indicates how profitable a company is in relation to its total assets, how efficiently uses assets to generate a profit. | |
| Return on Equity: | Outperform |
| ROE, a measure of financial performance calculated by dividing net income by equity. a gauge of profitability and efficiency. | |
| Debt to Equity: | Outperform |
| evaluate financial leverage, reflects the ability of equity to cover outstanding debts in the event of a business downturn. | |
| Stock Basics & Statistics | |
|---|---|
| Exchange: NASDAQ Global Select | |
| Sector: Healthcare | |
| Industry: Drug Manufacturers - Specialty & Generic | |
| Shares Out. (M) | 100.58 |
| Shares Float (M) | 98.29 |
| % Held by Insiders | |
| % Held by Institutions | 94.53 |
| Shares Short (K) | 2430 |
| Shares Short Prior Month (K) | 2180 |
| Stock Financials | |
|---|---|
| EPS | 2.470 |
| Book Value (p.s.) | 22.610 |
| Profit Margin | 13.23 |
| Operating Margin | 29.17 |
| Return on Assets (ttm) | 8.8 |
| Return on Equity (ttm) | 12.7 |
| Qtrly Rev. Growth | 25.0 |
| Gross Profit (p.s.) | |
| Sales Per Share | 18.791 |
| EBITDA (p.s.) | 4.137 |
| Qtrly Earnings Growth | 64.80 |
| Operating Cash Flow (M) | 389.90 |
| Levered Free Cash Flow (M) | 405.08 |
| Stock Valuation | |
|---|---|
| PE Ratio | 55.77 |
| PEG Ratio | 1.54 |
| Price to Book value | 6.09 |
| Price to Sales | 7.33 |
| Price to Cash Flow | 35.54 |
| Stock Dividends | |
|---|---|
| Dividend | |
| Dividend Yield | |
| Dividend Growth | |