| Noble Corp Plc (NE) | |||
|---|---|---|---|
| 45.46 -0.59 (-1.28%) | 04-25 16:00 | ||
| Open: | 45.68 | Pre. Close: | 46.05 |
| High: | 45.81 | Low: | 45.205 |
| Volume: | 736,890 | Market Cap: | 6,232(M) |
| Stock Technical Analysis | |
|---|---|
| Overall: |  |
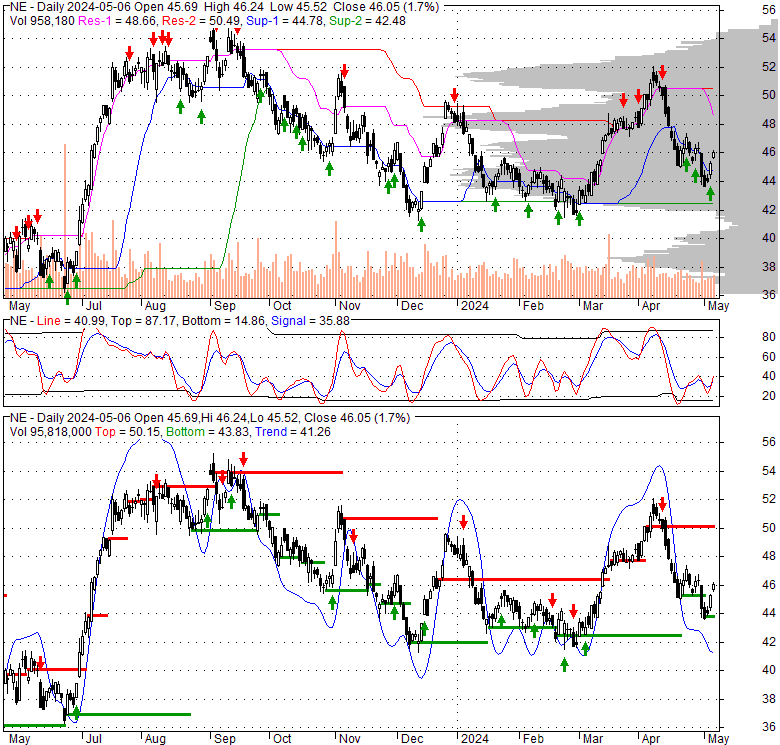
| Target: | Six months: 57.69 One year: 60.92 |
| Support: | Support1: 44.93 Support2: 37.38 |
| Resistance: | Resistance1: 49.40 Resistance2: 52.15 |
| Pivot: | 47.97 |
| Moving Averages: | MA(5): 46.22 MA(20): 48.24 MA(100): 45.68 MA(250): 46.02 |
| MACD: | MACD(12,26): -0.33 Signal(12,26,9): 0.17 |
| %K %D: | %K(14,3): 17.67 %D(3): 20.50 |
| RSI: | RSI(14): 39.92 |
| 52-Week: | High: 55.34 Low: 34.85 Change(%): 23.4 |
| Average Vol(K): | 3-Month: 1141 10-Days: 946 |
| Prices Prediction (Update @5:00pm) | ||
|---|---|---|
| If tomorrow: | Open lower | Open higher |
| High: | 45.847 - 46.097 | 46.097 - 46.305 |
| Low: | 44.594 - 44.911 | 44.911 - 45.174 |
| Close: | 44.983 - 45.466 | 45.466 - 45.868 |
| Price, MAs and Bollinger Bands |
|---|
| Price has closed below its short-term moving average. Short-term moving average is currently below mid-term; and above long-term moving average. From the relationship between price and moving averages: This stock is BEARISH in short-term; and NEUTRAL in mid-long term.[ NE ] has closed above bottom band by 20.2%. Bollinger Bands are 60.1% wider than normal. The large width of the bands suggest high volatility as compared to its normal range. The bands have been in this wide range for 4 days. This is a sign that the current trend might continue. |
| Company profile |
|---|
| Noble Corporation, together with its subsidiaries, operates as an offshore drilling contractor for the oil and gas industry worldwide. The company provides contract drilling services to the oil and gas industry through its fleet of mobile offshore drilling units. As of February 16, 2022, it operated a fleet of 20 offshore drilling units, which included 12 floaters and 8 jackups. The company was formerly known as Noble Holding Corporation plc. Noble Corporation was founded in 1921 and is headquartered in Sugar Land, Texas. |
| Stock chart |
|---|
 |
| Financial Analysis | |
|---|---|
| Price to Book Value: | Outperform |
| P/BV, a ratio used to compare book value to its current market price, to gauge whether a stock is valued properly. | |
| Price to Earnings: | Outperform |
| PE, the ratio for valuing a company that measures its current share price relative to its earnings per share (EPS). | |
| Discounted cash flow: | Neutral |
| DCF, a valuation method used to estimate the value of an investment based on its expected future cash flows. | |
| Return on Assets: | Outperform |
| ROA, indicates how profitable a company is in relation to its total assets, how efficiently uses assets to generate a profit. | |
| Return on Equity: | Outperform |
| ROE, a measure of financial performance calculated by dividing net income by equity. a gauge of profitability and efficiency. | |
| Debt to Equity: | Outperform |
| evaluate financial leverage, reflects the ability of equity to cover outstanding debts in the event of a business downturn. | |
| Stock Basics & Statistics | |
|---|---|
| Exchange: New York Stock Exchange | |
| Sector: Energy | |
| Industry: Oil & Gas Drilling | |
| Shares Out. (M) | 142.82 |
| Shares Float (M) | 140.22 |
| % Held by Insiders | 21.84 |
| % Held by Institutions | 70.76 |
| Shares Short (K) | 7290 |
| Shares Short Prior Month (K) | 6420 |
| Stock Financials | |
|---|---|
| EPS | 3.320 |
| Book Value (p.s.) | 27.850 |
| Profit Margin | 19.58 |
| Operating Margin | 21.20 |
| Return on Assets (ttm) | 7.2 |
| Return on Equity (ttm) | 12.8 |
| Qtrly Rev. Growth | 4.0 |
| Gross Profit (p.s.) | |
| Sales Per Share | 17.224 |
| EBITDA (p.s.) | 5.671 |
| Qtrly Earnings Growth | 12.30 |
| Operating Cash Flow (M) | 574.34 |
| Levered Free Cash Flow (M) | 192.47 |
| Stock Valuation | |
|---|---|
| PE Ratio | 13.69 |
| PEG Ratio | 0.20 |
| Price to Book value | 1.63 |
| Price to Sales | 2.64 |
| Price to Cash Flow | 11.30 |
| Stock Dividends | |
|---|---|
| Dividend | |
| Dividend Yield | |
| Dividend Growth | |


