| Net Element Inc. (NETE) | |||
|---|---|---|---|
| 13.09 1.04 (8.63%) | 11-05 00:00 | ||
| Open: | 12.67 | Pre. Close: | 12.05 |
| High: | 14.95 | Low: | 11.82 |
| Volume: | 4,070,566 | Market Cap: | 27,820(M) |
| Stock Technical Analysis | |
|---|---|
| Overall: |  |
| Target: | Six months: 13.89 One year: 17.46 |
| Support: | Support1: 6.95 Support2: 5.78 |
| Resistance: | Resistance1: 11.89 Resistance2: 14.95 |
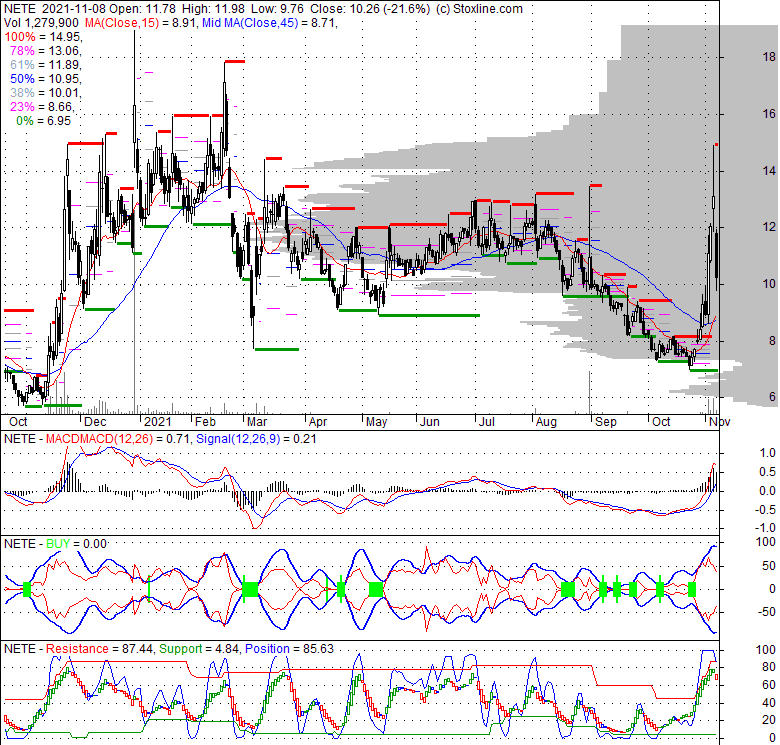
| Pivot: | 8.91 |
| Moving Averages: | MA(5): 11.08 MA(20): 8.62 MA(100): 10.18 MA(250): 11.05 |
| MACD: | MACD(12,26): 0.71 Signal(12,26,9): 0.21 |
| %K %D: | %K(14,3): 71.94 %D(3): 80.60 |
| RSI: | RSI(14): 56.57 |
| 52-Week: | High: 19.15 Low: 6.95 Change(%): 66.8 |
| Average Vol(K): | 3-Month: 58723 10-Days: 128408 |
| Prices Prediction (Update @5:00pm) | ||
|---|---|---|
| If tomorrow: | Open lower | Open higher |
| High: | 11.987 - 12.048 | 12.048 - 12.095 |
| Low: | 9.641 - 9.695 | 9.695 - 9.736 |
| Close: | 10.172 - 10.265 | 10.265 - 10.337 |
| Price, MAs and Bollinger Bands |
|---|
| Price and moving averages has closed above its Short term moving average. Short term moving average is currently above mid-term; AND below long term moving averages. From the relationship between price and moving averages; we can see that: This stock is BULLISH in short-term; and NEUTRAL in mid-long term.NETE has closed below upper band by 31.4%. Bollinger Bands are 267% wider than normal. The large width of the bands suggest high volatility as compared to NETE's normal range. The bands have been in this wide range for 3 bars. This is a sign that the current trend might continue. |
| Company profile |
|---|
| Net Element, Inc. provides mobile payments and other transactional services. The company is headquartered in North Miami Beach, Florida and currently employs 88 full-time employees. The firm is a global transaction processing technology and value-added solutions company. The company operates through segments, including North America Transaction Solutions, Mobile Solutions, Online Solutions and Corporate Expenses & Eliminations. Through TOT Group Russia and Net Element Russia, it provides transactional services, mobile payment transactions, online payment transactions and other payment technologies in countries in the Russian Federation, Commonwealth of Independent States, Europe and Asia. The North America Transaction Solutions segment provides technology and services that businesses require in accepting cashless transaction. The Russian mobile and online payment processing segment consists of Digital Provider. The Online Solutions segment consists of PayOnline, which includes a protected payment processing system to accept bank card payments for goods and services. |
| Stock chart |
|---|
 |
| Financial Analysis | |
|---|---|
| Price to Book Value: | Underperform |
| P/BV, a ratio used to compare book value to its current market price, to gauge whether a stock is valued properly. | |
| Price to Earnings: | Neutral |
| PE, the ratio for valuing a company that measures its current share price relative to its earnings per share (EPS). | |
| Discounted cash flow: | Outperform |
| DCF, a valuation method used to estimate the value of an investment based on its expected future cash flows. | |
| Return on Assets: | Underperform |
| ROA, indicates how profitable a company is in relation to its total assets, how efficiently uses assets to generate a profit. | |
| Return on Equity: | Outperform |
| ROE, a measure of financial performance calculated by dividing net income by equity. a gauge of profitability and efficiency. | |
| Debt to Equity: | Underperform |
| evaluate financial leverage, reflects the ability of equity to cover outstanding debts in the event of a business downturn. | |
| Stock Basics & Statistics | |
|---|---|
| Exchange: NASDAQ Capital Market | |
| Sector: Technology | |
| Industry: Software - Infrastructure | |
| Shares Out. (M) | 6.40 |
| Shares Float (M) | 4.82 |
| % Held by Insiders | 11.10 |
| % Held by Institutions | 9.87 |
| Shares Short (K) | 368 |
| Shares Short Prior Month (K) | 560 |
| Stock Financials | |
|---|---|
| EPS | -0.500 |
| Book Value (p.s.) | 1.240 |
| Profit Margin | -2.88 |
| Operating Margin | -3.42 |
| Return on Assets (ttm) | -7.6 |
| Return on Equity (ttm) | -62.2 |
| Qtrly Rev. Growth | 142.7 |
| Gross Profit (p.s.) | 1.538 |
| Sales Per Share | 14.567 |
| EBITDA (p.s.) | -0.069 |
| Qtrly Earnings Growth | |
| Operating Cash Flow (M) | 2.14 |
| Levered Free Cash Flow (M) | -0.33 |
| Stock Valuation | |
|---|---|
| PE Ratio | -20.52 |
| PEG Ratio | |
| Price to Book value | 8.27 |
| Price to Sales | 0.70 |
| Price to Cash Flow | 30.68 |
| Stock Dividends | |
|---|---|
| Dividend | |
| Dividend Yield | |
| Dividend Growth | |


