| Novan Inc (NOVN) | |||
|---|---|---|---|
| 0.0941 -0.031 (-24.84%) | 07-25 16:00 | ||
| Open: | 0.1368 | Pre. Close: | 0.1252 |
| High: | 0.1395 | Low: | 0.082 |
| Volume: | 6,929,105 | Market Cap: | 3(M) |
| Stock Technical Analysis | |
|---|---|
| Overall: |  |
| Target: | Six months: 0.06 One year: 0.09 |
| Support: | Support1: 0.02 Support2: 0.02 |
| Resistance: | Resistance1: 0.06 Resistance2: 0.08 |
| Pivot: | 0.03 |
| Moving Averages: | MA(5): 0.03 MA(20): 0.04 MA(100): 0.49 MA(250): 0.98 |
| MACD: | MACD(12,26): -0.02 Signal(12,26,9): -0.03 |
| %K %D: | %K(14,3): 15.06 %D(3): 14.92 |
| RSI: | RSI(14): 32.24 |
| 52-Week: | High: 3.33 Low: 0.082 Change(%): -98.7 |
| Average Vol(K): | 3-Month: 1090 10-Days: 110 |
| Prices Prediction (Update @5:00pm) | ||
|---|---|---|
| If tomorrow: | Open lower | Open higher |
| High: | 0.03 - 0.03 | 0.03 - 0.03 |
| Low: | 0.02 - 0.02 | 0.02 - 0.02 |
| Close: | 0.02 - 0.02 | 0.02 - 0.02 |
| Price, MAs and Bollinger Bands |
|---|
| Price has closed below its short-term moving average. Short-term moving average is currently below mid-term; and below long-term moving average. From the relationship between price and moving averages: This stock is BEARISH in short-term; and BEARISH in mid-long term.[ NOVN ] has closed above bottom band by 31.3%. Bollinger Bands are 88.5% narrower than normal. The narrow width of the bands suggests low volatility as compared to its normal range. The bands have been in this narrow range for 33 bars. This is a sign that the market may be about to initiate a new trend. |
| Company profile |
|---|
| Novan, Inc., a pre-commercial nitric oxide-based pharmaceutical company, focuses on dermatology and anti-infective therapies. Its clinical stage dermatology drug candidates include SB204, a topical monotherapy for the treatment of acne vulgaris; SB206, a topical anti-viral gel for the treatment of viral skin infections; SB208, a topical broad-spectrum anti-fungal gel for the treatment of fungal infections of the skin and nails, including athlete's foot and fungal nail infections; and SB414, a topical cream-based gel product candidate for the treatment of inflammatory skin diseases. The company also develops SB207, an anti-viral product candidate for the treatment of external genital warts; WH602, a nitric oxide-containing intravaginal gel to treat high-risk human papilloma virus (HPV); WH504, a non-gel formulation product candidate to treat high-risk HPV; and SB019 for the treatment of SARS-CoV-2. Novan, Inc. has a license agreement with Sato Pharmaceutical Co., Ltd.; and a strategic alliance with Orion Corporation. Novan, Inc. was incorporated in 2006 and is headquartered in Durham, North Carolina. |
| Stock chart |
|---|
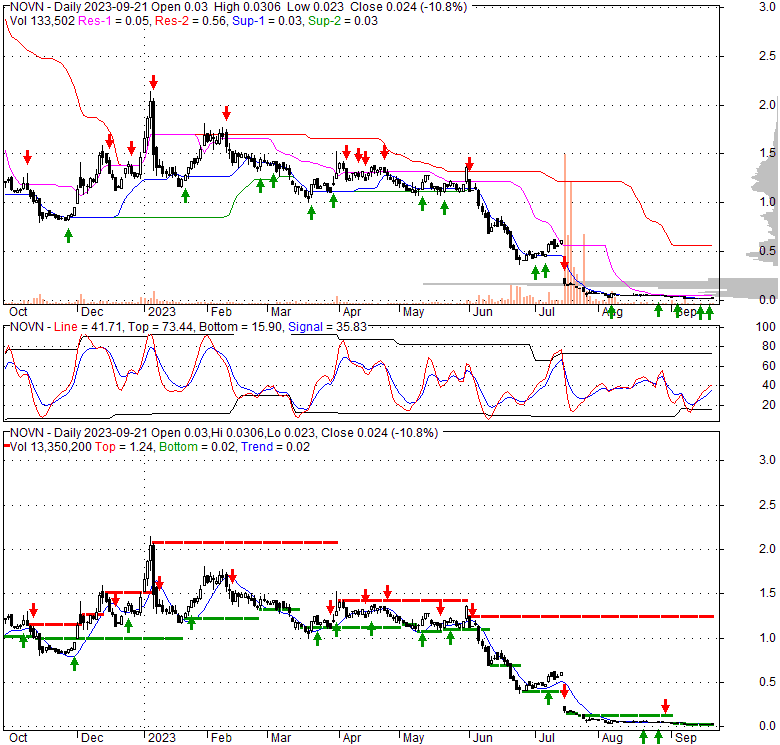 |
| Financial Analysis | |
|---|---|
| Price to Book Value: | Underperform |
| P/BV, a ratio used to compare book value to its current market price, to gauge whether a stock is valued properly. | |
| Price to Earnings: | Neutral |
| PE, the ratio for valuing a company that measures its current share price relative to its earnings per share (EPS). | |
| Discounted cash flow: | Outperform |
| DCF, a valuation method used to estimate the value of an investment based on its expected future cash flows. | |
| Return on Assets: | Underperform |
| ROA, indicates how profitable a company is in relation to its total assets, how efficiently uses assets to generate a profit. | |
| Return on Equity: | Outperform |
| ROE, a measure of financial performance calculated by dividing net income by equity. a gauge of profitability and efficiency. | |
| Debt to Equity: | Underperform |
| evaluate financial leverage, reflects the ability of equity to cover outstanding debts in the event of a business downturn. | |
| Stock Basics & Statistics | |
|---|---|
| Exchange: NASDAQ Capital Market | |
| Sector: Healthcare | |
| Industry: Biotechnology | |
| Shares Out. (M) | |
| Shares Float (M) | |
| % Held by Insiders | |
| % Held by Institutions | |
| Shares Short (K) | |
| Shares Short Prior Month (K) | |
| Stock Financials | |
|---|---|
| EPS | |
| Book Value (p.s.) | |
| Profit Margin | |
| Operating Margin | |
| Return on Assets (ttm) | |
| Return on Equity (ttm) | |
| Qtrly Rev. Growth | |
| Gross Profit (p.s.) | 401.250 |
| Sales Per Share | 618.063 |
| EBITDA (p.s.) | 1956250.000 |
| Qtrly Earnings Growth | |
| Operating Cash Flow (M) | |
| Levered Free Cash Flow (M) | |
| Stock Valuation | |
|---|---|
| PE Ratio | |
| PEG Ratio | |
| Price to Book value | |
| Price to Sales | |
| Price to Cash Flow | |
| Stock Dividends | |
|---|---|
| Dividend | |
| Dividend Yield | |
| Dividend Growth | |


