| Invitae Corp (NVTA) | |||
|---|---|---|---|
| 0.019 -0.011 (-35.59%) | 02-14 15:59 | ||
| Open: | 0.0172 | Pre. Close: | 0.0295 |
| High: | 0.024 | Low: | 0.016 |
| Volume: | 22,459,258 | Market Cap: | 5(M) |
| Stock Technical Analysis | |
|---|---|
| Overall: |  |
| Target: | Six months: 0.01 One year: 0.02 |
| Support: | Support1: Support2: |
| Resistance: | Resistance1: 0.01 Resistance2: 0.02 |
| Pivot: | 0.01 |
| Moving Averages: | MA(5): MA(20): 0.01 MA(100): 0.29 MA(250): 0.72 |
| MACD: | MACD(12,26): -0.01 Signal(12,26,9): -0.02 |
| %K %D: | %K(14,3): 18.97 %D(3): 8.56 |
| RSI: | RSI(14): 34.56 |
| 52-Week: | High: 2.34 Low: 0.015 Change(%): -99.3 |
| Average Vol(K): | 3-Month: 9912 10-Days: 1568 |
| Prices Prediction (Update @5:00pm) | ||
|---|---|---|
| If tomorrow: | Open lower | Open higher |
| High: | 0 - 0 | 0 - 0 |
| Low: | 0 - 0 | 0 - 0 |
| Close: | 0 - 0 | 0 - 0 |
| Price, MAs and Bollinger Bands |
|---|
| Price has closed above its short-term moving average. Short-term moving average is currently below mid-term; and below long-term moving average. From the relationship between price and moving averages: This stock is NEUTRAL in short-term; and BEARISH in mid-long term.[ NVTA ] has closed below upper band by 41.4%. Bollinger Bands are 88.8% narrower than normal. The narrow width of the bands suggests low volatility as compared to its normal range. The bands have been in this narrow range for 33 bars. This is a sign that the market may be about to initiate a new trend. |
| Company profile |
|---|
| Invitae Corporation, a medical genetics company, integrates genetic information into mainstream medicine to improve healthcare of people in the United States, Canada, and internationally. The company offers genetic tests in various clinical areas, including hereditary cancer, cardiology, neurology, pediatrics, oncology, metabolic conditions, and rare diseases; digital health solutions; and health data services. It serves patients, healthcare providers, biopharma companies, and other partners. The company was formerly known as Locus Development, Inc. and changed its name to Invitae Corporation in 2012. Invitae Corporation was incorporated in 2010 and is headquartered in San Francisco, California. |
| Stock chart |
|---|
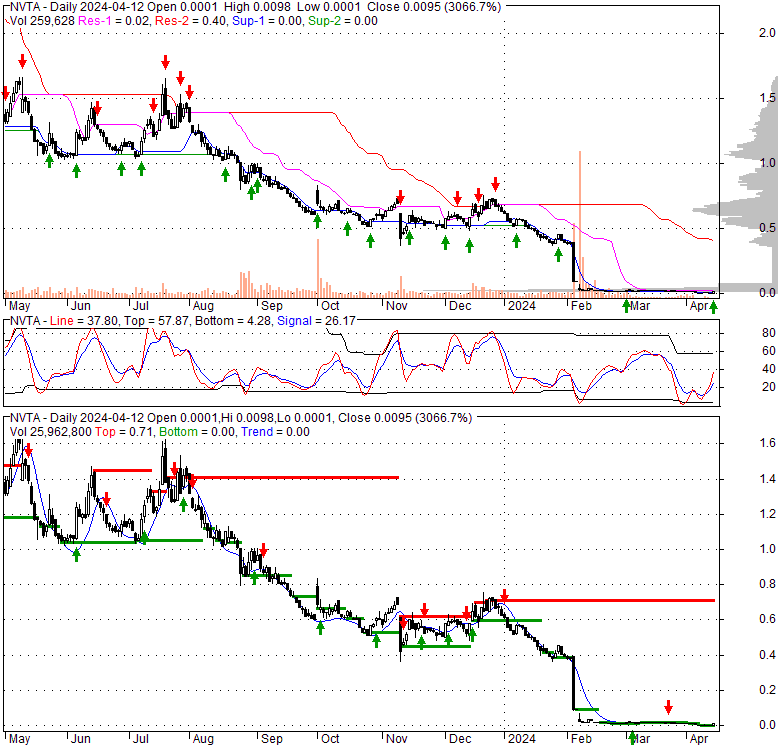 |
| Financial Analysis | |
|---|---|
| Price to Book Value: | Underperform |
| P/BV, a ratio used to compare book value to its current market price, to gauge whether a stock is valued properly. | |
| Price to Earnings: | Neutral |
| PE, the ratio for valuing a company that measures its current share price relative to its earnings per share (EPS). | |
| Discounted cash flow: | Outperform |
| DCF, a valuation method used to estimate the value of an investment based on its expected future cash flows. | |
| Return on Assets: | Underperform |
| ROA, indicates how profitable a company is in relation to its total assets, how efficiently uses assets to generate a profit. | |
| Return on Equity: | Outperform |
| ROE, a measure of financial performance calculated by dividing net income by equity. a gauge of profitability and efficiency. | |
| Debt to Equity: | Underperform |
| evaluate financial leverage, reflects the ability of equity to cover outstanding debts in the event of a business downturn. | |
| Stock Basics & Statistics | |
|---|---|
| Exchange: New York Stock Exchange | |
| Sector: Healthcare | |
| Industry: Medical - Diagnostics & Research | |
| Shares Out. (M) | 286.49 |
| Shares Float (M) | 284.38 |
| % Held by Insiders | 1.51 |
| % Held by Institutions | 47.96 |
| Shares Short (K) | 67760 |
| Shares Short Prior Month (K) | 59350 |
| Stock Financials | |
|---|---|
| EPS | -5.360 |
| Book Value (p.s.) | -3.780 |
| Profit Margin | -299.14 |
| Operating Margin | -84.87 |
| Return on Assets (ttm) | -23.7 |
| Return on Equity (ttm) | |
| Qtrly Rev. Growth | -9.2 |
| Gross Profit (p.s.) | |
| Sales Per Share | 1.681 |
| EBITDA (p.s.) | -1.235 |
| Qtrly Earnings Growth | |
| Operating Cash Flow (M) | -238.22 |
| Levered Free Cash Flow (M) | -34.70 |
| Stock Valuation | |
|---|---|
| PE Ratio | |
| PEG Ratio | |
| Price to Book value | |
| Price to Sales | |
| Price to Cash Flow | -0.01 |
| Stock Dividends | |
|---|---|
| Dividend | |
| Dividend Yield | |
| Dividend Growth | |


