| Natwest Group Plc ADR (NWG) | |||
|---|---|---|---|
| 7.78 0.04 (0.52%) | 05-03 16:00 | ||
| Open: | 7.82 | Pre. Close: | 7.74 |
| High: | 7.84 | Low: | 7.755 |
| Volume: | 1,310,944 | Market Cap: | 33,878(M) |
| Stock Technical Analysis | |
|---|---|
| Overall: |  |
| Target: | Six months: 9.19 One year: 10.74 |
| Support: | Support1: 7.15 Support2: 6.70 |
| Resistance: | Resistance1: 7.87 Resistance2: 9.19 |
| Pivot: | 7.33 |
| Moving Averages: | MA(5): 7.74 MA(20): 7.26 MA(100): 6.21 MA(250): 6.01 |
| MACD: | MACD(12,26): 0.29 Signal(12,26,9): 0.25 |
| %K %D: | %K(14,3): 90.18 %D(3): 88.19 |
| RSI: | RSI(14): 74.67 |
| 52-Week: | High: 7.87 Low: 4.3 Change(%): 17.3 |
| Average Vol(K): | 3-Month: 1753 10-Days: 1539 |
| Prices Prediction (Update @5:00pm) | ||
|---|---|---|
| If tomorrow: | Open lower | Open higher |
| High: | 7.846 - 7.883 | 7.883 - 7.918 |
| Low: | 7.663 - 7.707 | 7.707 - 7.748 |
| Close: | 7.71 - 7.777 | 7.777 - 7.84 |
| Price, MAs and Bollinger Bands |
|---|
| Price has closed above its short-term moving average. Short-term moving average is currently above mid-term; and above long-term moving average. From the relationship between price and moving averages: This stock is BULLISH in short-term; and BULLISH in mid-long term.[ NWG ] has closed below upper band by 20.2%. Bollinger Bands are 103.5% wider than normal. The large width of the bands suggest high volatility as compared to its normal range. The bands have been in this wide range for 5 days. This is a sign that the current trend might continue. |
| Company profile |
|---|
| NatWest Group plc, together with its subsidiaries, provides banking and financial products and services to personal, commercial, corporate, and institutional customers in the United Kingdom and internationally. It operates through Retail Banking, Commercial Banking, Private Banking, RBS International, and NatWest Markets segments. The Retail Banking segment offers a range of banking products and related financial services, such as current accounts, mortgages, personal unsecured lending, and personal deposits, as well as mobile and online banking services. The Commercial Banking segment offers banking and financing solutions to start-up, SME, commercial, corporate, and institutional customers. The Private Banking segment provides private banking and wealth management products for high-net-worth individuals and their business interests. The RBS International segment offers banking various products and services to institutional customers. It also operates in wholesale branches and fund depositary service businesses. The NatWest Markets segment provides services to corporate and institutional customers for the management of financial risks for achieving short-term and long-term sustainable financial goals. NatWest Group plc operates approximately 800 branches and 16,000 physical points of presence. The company was formerly known as The Royal Bank of Scotland Group plc and changed its name to NatWest Group plc in July 2020. NatWest Group plc was founded in 1727 and is headquartered in Edinburgh, the United Kingdom. |
| Stock chart |
|---|
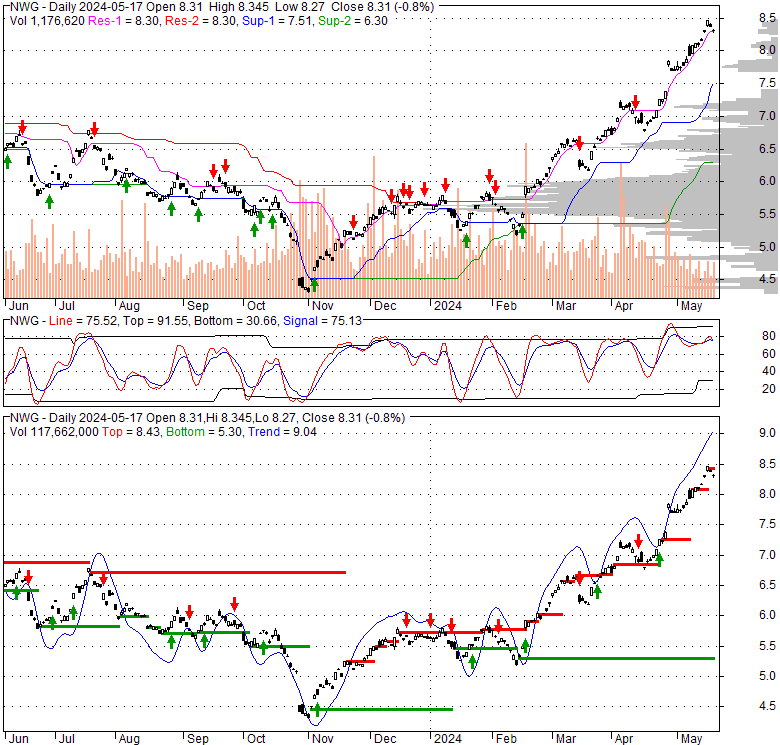 |
| Financial Analysis | |
|---|---|
| Price to Book Value: | Outperform |
| P/BV, a ratio used to compare book value to its current market price, to gauge whether a stock is valued properly. | |
| Price to Earnings: | Outperform |
| PE, the ratio for valuing a company that measures its current share price relative to its earnings per share (EPS). | |
| Discounted cash flow: | Underperform |
| DCF, a valuation method used to estimate the value of an investment based on its expected future cash flows. | |
| Return on Assets: | Underperform |
| ROA, indicates how profitable a company is in relation to its total assets, how efficiently uses assets to generate a profit. | |
| Return on Equity: | Outperform |
| ROE, a measure of financial performance calculated by dividing net income by equity. a gauge of profitability and efficiency. | |
| Debt to Equity: | Outperform |
| evaluate financial leverage, reflects the ability of equity to cover outstanding debts in the event of a business downturn. | |
| Stock Basics & Statistics | |
|---|---|
| Exchange: New York Stock Exchange | |
| Sector: Financial Services | |
| Industry: Banks - Diversified | |
| Shares Out. (M) | |
| Shares Float (M) | 4360.00 |
| % Held by Insiders | 6200000000.00 |
| % Held by Institutions | |
| Shares Short (K) | 10660 |
| Shares Short Prior Month (K) | |
| Stock Financials | |
|---|---|
| EPS | |
| Book Value (p.s.) | 7.800 |
| Profit Margin | 683.19 |
| Operating Margin | 32.71 |
| Return on Assets (ttm) | 36.8 |
| Return on Equity (ttm) | 0.7 |
| Qtrly Rev. Growth | 14170000384.0 |
| Gross Profit (p.s.) | -6.296 |
| Sales Per Share | 9.541 |
| EBITDA (p.s.) | |
| Qtrly Earnings Growth | 1.22 |
| Operating Cash Flow (M) | |
| Levered Free Cash Flow (M) | -223.00 |
| Stock Valuation | |
|---|---|
| PE Ratio | |
| PEG Ratio | 2.00 |
| Price to Book value | |
| Price to Sales | 0.81 |
| Price to Cash Flow | 2.78 |
| Stock Dividends | |
|---|---|
| Dividend | |
| Dividend Yield | |
| Dividend Growth | 10830000.000 |


