| News Corp Cl A (NWSA) | |||
|---|---|---|---|
| 24.22 0.01 (0.04%) | 04-26 16:00 | ||
| Open: | 24.17 | Pre. Close: | 24.21 |
| High: | 24.32 | Low: | 23.99 |
| Volume: | 1,599,593 | Market Cap: | 13,876(M) |
| Stock Technical Analysis | |
|---|---|
| Overall: |  |
| Target: | Six months: 29.83 One year: 30.99 |
| Support: | Support1: 23.94 Support2: 19.92 |
| Resistance: | Resistance1: 25.54 Resistance2: 26.53 |
| Pivot: | 24.53 |
| Moving Averages: | MA(5): 24.41 MA(20): 24.81 MA(100): 24.83 MA(250): 21.94 |
| MACD: | MACD(12,26): -0.40 Signal(12,26,9): -0.38 |
| %K %D: | %K(14,3): 18.47 %D(3): 23.15 |
| RSI: | RSI(14): 36.76 |
| 52-Week: | High: 28 Low: 16.35 Change(%): 37.5 |
| Average Vol(K): | 3-Month: 2821 10-Days: 1644 |
| Prices Prediction (Update @5:00pm) | ||
|---|---|---|
| If tomorrow: | Open lower | Open higher |
| High: | 24.332 - 24.452 | 24.452 - 24.574 |
| Low: | 23.705 - 23.831 | 23.831 - 23.958 |
| Close: | 24.019 - 24.217 | 24.217 - 24.418 |
| Price, MAs and Bollinger Bands |
|---|
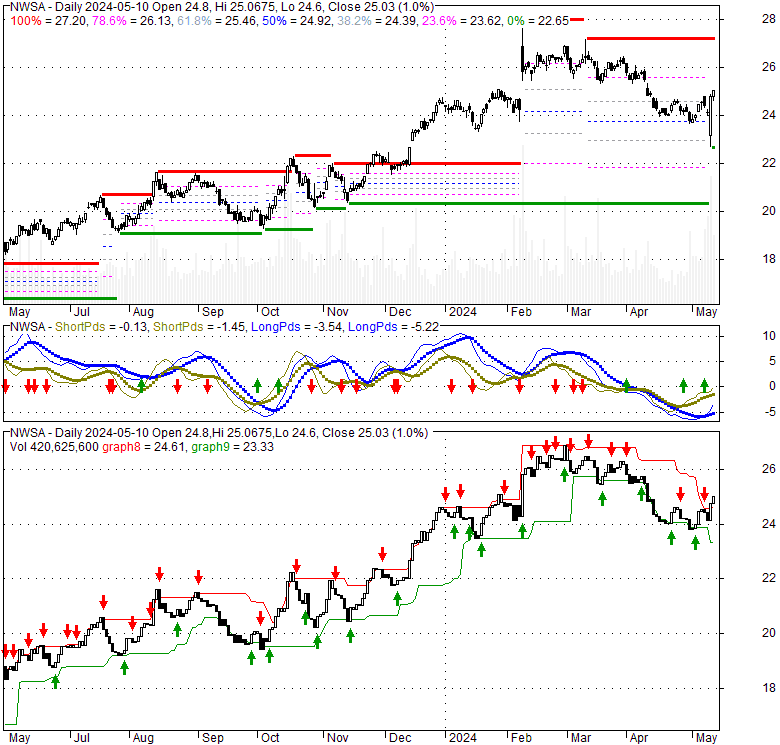
| Price has closed below its short-term moving average. Short-term moving average is currently below mid-term; and below long-term moving average. From the relationship between price and moving averages: This stock is BEARISH in short-term; and NEUTRAL in mid-long term.[ NWSA ] has closed above bottom band by 34.6%. Bollinger Bands are 8.1% wider than normal. The current width of the bands does not suggest anything about the future direction or movement of prices. |
| Company profile |
|---|
| News Corporation, a media and information services company, creates and distributes authoritative and engaging content, and other products and services for consumers and businesses worldwide. It operates in six segments: Digital Real Estate Services, Subscription Video Services, Dow Jones, Book Publishing, News Media, and Other. The company distributes content and data products, including The Wall Street Journal, Barron's, MarketWatch, Investor's Business Daily, Factiva, Dow Jones Risk & Compliance, Dow Jones Newswires, and OPIS through various media channels, such as newspapers, newswires, websites, mobile apps, newsletters, magazines, proprietary databases, live journalism, video, and podcasts. It also owns and operates daily, Sunday, weekly, and bi-weekly newspapers comprising The Australian, The Weekend Australian, The Daily Telegraph, The Sunday Telegraph, Herald Sun, Sunday Herald Sun, The Courier Mail, The Sunday Mail, The Advertiser, Sunday Mail, The Sun, The Sun on Sunday, The Times, The Sunday Times, and New York Post, as well as digital mastheads and other websites. In addition, the company publishes general fiction, nonfiction, children's, and religious books; provides sports, entertainment, and news services to pay-TV and streaming subscribers, and other commercial licensees through cable, satellite, and internet distribution; and broadcasts rights to live sporting events. Further, it offers property and property-related advertising and services on its websites and mobile applications; online real estate services; and financial services. The company was founded in 2012 and is headquartered in New York, New York. |
| Stock chart |
|---|
 |
| Financial Analysis | |
|---|---|
| Price to Book Value: | Neutral |
| P/BV, a ratio used to compare book value to its current market price, to gauge whether a stock is valued properly. | |
| Price to Earnings: | Outperform |
| PE, the ratio for valuing a company that measures its current share price relative to its earnings per share (EPS). | |
| Discounted cash flow: | Neutral |
| DCF, a valuation method used to estimate the value of an investment based on its expected future cash flows. | |
| Return on Assets: | Outperform |
| ROA, indicates how profitable a company is in relation to its total assets, how efficiently uses assets to generate a profit. | |
| Return on Equity: | Neutral |
| ROE, a measure of financial performance calculated by dividing net income by equity. a gauge of profitability and efficiency. | |
| Debt to Equity: | Neutral |
| evaluate financial leverage, reflects the ability of equity to cover outstanding debts in the event of a business downturn. | |
| Stock Basics & Statistics | |
|---|---|
| Exchange: NASDAQ Global Select | |
| Sector: Communication Services | |
| Industry: Entertainment | |
| Shares Out. (M) | 377.29 |
| Shares Float (M) | 493.09 |
| % Held by Insiders | 0.08 |
| % Held by Institutions | 102.59 |
| Shares Short (K) | 8570 |
| Shares Short Prior Month (K) | 7810 |
| Stock Financials | |
|---|---|
| EPS | 0.400 |
| Book Value (p.s.) | 14.300 |
| Profit Margin | 2.29 |
| Operating Margin | 11.37 |
| Return on Assets (ttm) | 2.9 |
| Return on Equity (ttm) | 3.0 |
| Qtrly Rev. Growth | 2.6 |
| Gross Profit (p.s.) | |
| Sales Per Share | 26.399 |
| EBITDA (p.s.) | 3.340 |
| Qtrly Earnings Growth | 132.10 |
| Operating Cash Flow (M) | 1240.00 |
| Levered Free Cash Flow (M) | 789.50 |
| Stock Valuation | |
|---|---|
| PE Ratio | 60.55 |
| PEG Ratio | -13.64 |
| Price to Book value | 1.69 |
| Price to Sales | 0.92 |
| Price to Cash Flow | 7.37 |
| Stock Dividends | |
|---|---|
| Dividend | |
| Dividend Yield | |
| Dividend Growth | |