| New York Mtge Trust (NYMT) | |||
|---|---|---|---|
| 7.04 0.07 (1%) | 04-26 16:00 | ||
| Open: | 7 | Pre. Close: | 6.97 |
| High: | 7.1092 | Low: | 7 |
| Volume: | 322,981 | Market Cap: | 642(M) |
| Stock Technical Analysis | |
|---|---|
| Overall: |  |
| Target: | Six months: 8.58 One year: 10.03 |
| Support: | Support1: 6.95 Support2: 6.70 |
| Resistance: | Resistance1: 7.35 Resistance2: 8.58 |
| Pivot: | 7.01 |
| Moving Averages: | MA(5): 7.07 MA(20): 7.06 MA(100): 7.75 MA(250): 8.62 |
| MACD: | MACD(12,26): -0.05 Signal(12,26,9): -0.07 |
| %K %D: | %K(14,3): 52.28 %D(3): 59.04 |
| RSI: | RSI(14): 48.73 |
| 52-Week: | High: 10.63 Low: 6.7 Change(%): -31.5 |
| Average Vol(K): | 3-Month: 628 10-Days: 614 |
| Prices Prediction (Update @5:00pm) | ||
|---|---|---|
| If tomorrow: | Open lower | Open higher |
| High: | 7.114 - 7.149 | 7.149 - 7.184 |
| Low: | 6.917 - 6.954 | 6.954 - 6.991 |
| Close: | 6.982 - 7.039 | 7.039 - 7.098 |
| Price, MAs and Bollinger Bands |
|---|
| Price has closed below its short-term moving average. Short-term moving average is currently below mid-term; and below long-term moving average. From the relationship between price and moving averages: This stock is BEARISH in short-term; and BEARISH in mid-long term.[ NYMT ] has closed below upper band by 45.2%. Bollinger Bands are 21.8% narrower than normal. The current width of the bands does not suggest anything about the future direction or movement of prices. |
| Company profile |
|---|
| New York Mortgage Trust, Inc. acquires, invests in, finances, and manages mortgage-related single-family and multi-family residential assets in the United States. Its targeted investments include residential loans, second mortgages, and business purpose loans; structured multi-family property investments, such as preferred equity in, and mezzanine loans to owners of multi-family properties, as well as joint venture equity investments in multi-family properties; non-agency residential mortgage-backed securities (RMBS); agency RMBS; commercial mortgage-backed securities (CMBS); and other mortgage, residential housing, and credit-related assets. The company qualifies as a real estate investment trust for federal income tax purposes. It generally would not be subject to federal corporate income taxes if it distributes at least 90% of its taxable income to its stockholders. The company was incorporated in 2003 and is headquartered in New York, New York. |
| Stock chart |
|---|
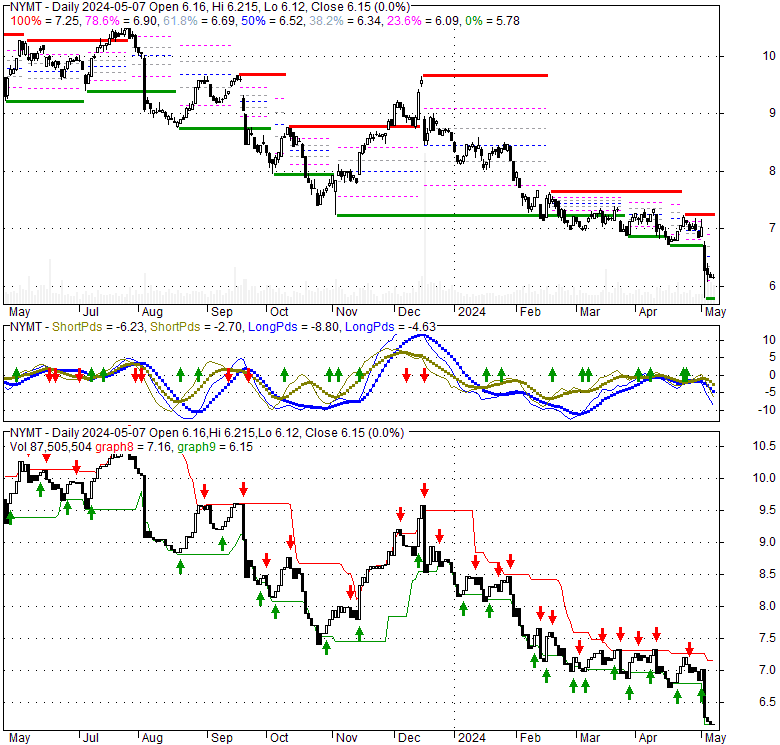 |
| Financial Analysis | |
|---|---|
| Price to Book Value: | Underperform |
| P/BV, a ratio used to compare book value to its current market price, to gauge whether a stock is valued properly. | |
| Price to Earnings: | Neutral |
| PE, the ratio for valuing a company that measures its current share price relative to its earnings per share (EPS). | |
| Discounted cash flow: | Neutral |
| DCF, a valuation method used to estimate the value of an investment based on its expected future cash flows. | |
| Return on Assets: | Neutral |
| ROA, indicates how profitable a company is in relation to its total assets, how efficiently uses assets to generate a profit. | |
| Return on Equity: | Outperform |
| ROE, a measure of financial performance calculated by dividing net income by equity. a gauge of profitability and efficiency. | |
| Debt to Equity: | Outperform |
| evaluate financial leverage, reflects the ability of equity to cover outstanding debts in the event of a business downturn. | |
| Stock Basics & Statistics | |
|---|---|
| Exchange: NASDAQ Global Select | |
| Sector: Real Estate | |
| Industry: REIT - Mortgage | |
| Shares Out. (M) | |
| Shares Float (M) | 91.23 |
| % Held by Insiders | 89720000.00 |
| % Held by Institutions | 1.57 |
| Shares Short (K) | 1850 |
| Shares Short Prior Month (K) | |
| Stock Financials | |
|---|---|
| EPS | |
| Book Value (p.s.) | |
| Profit Margin | -23.17 |
| Operating Margin | 58.65 |
| Return on Assets (ttm) | -1.1 |
| Return on Equity (ttm) | -4.5 |
| Qtrly Rev. Growth | |
| Gross Profit (p.s.) | 497.347 |
| Sales Per Share | 107142856.000 |
| EBITDA (p.s.) | |
| Qtrly Earnings Growth | -0.99 |
| Operating Cash Flow (M) | |
| Levered Free Cash Flow (M) | 29.95 |
| Stock Valuation | |
|---|---|
| PE Ratio | |
| PEG Ratio | 1.64 |
| Price to Book value | |
| Price to Sales | |
| Price to Cash Flow | 1.20 |
| Stock Dividends | |
|---|---|
| Dividend | |
| Dividend Yield | |
| Dividend Growth | 2090000.000 |


