| Owens Corning Inc (OC) | |||
|---|---|---|---|
| 174.81 1.67 (0.96%) | 05-03 16:00 | ||
| Open: | 176.54 | Pre. Close: | 173.14 |
| High: | 178.24 | Low: | 174.06 |
| Volume: | 670,999 | Market Cap: | 15,148(M) |
| Stock Technical Analysis | |
|---|---|
| Overall: |  |
| Target: | Six months: 208.18 One year: 243.16 |
| Support: | Support1: 166.50 Support2: 159.25 |
| Resistance: | Resistance1: 178.24 Resistance2: 208.18 |
| Pivot: | 166.51 |
| Moving Averages: | MA(5): 171.18 MA(20): 166.83 MA(100): 155.66 MA(250): 139.52 |
| MACD: | MACD(12,26): 2.39 Signal(12,26,9): 1.77 |
| %K %D: | %K(14,3): 82.11 %D(3): 78.05 |
| RSI: | RSI(14): 64.53 |
| 52-Week: | High: 178.24 Low: 103.65 Change(%): 66.7 |
| Average Vol(K): | 3-Month: 754 10-Days: 717 |
| Prices Prediction (Update @5:00pm) | ||
|---|---|---|
| If tomorrow: | Open lower | Open higher |
| High: | 178.406 - 179.092 | 179.092 - 179.88 |
| Low: | 172.192 - 172.929 | 172.929 - 173.776 |
| Close: | 173.446 - 174.623 | 174.623 - 175.976 |
| Price, MAs and Bollinger Bands |
|---|
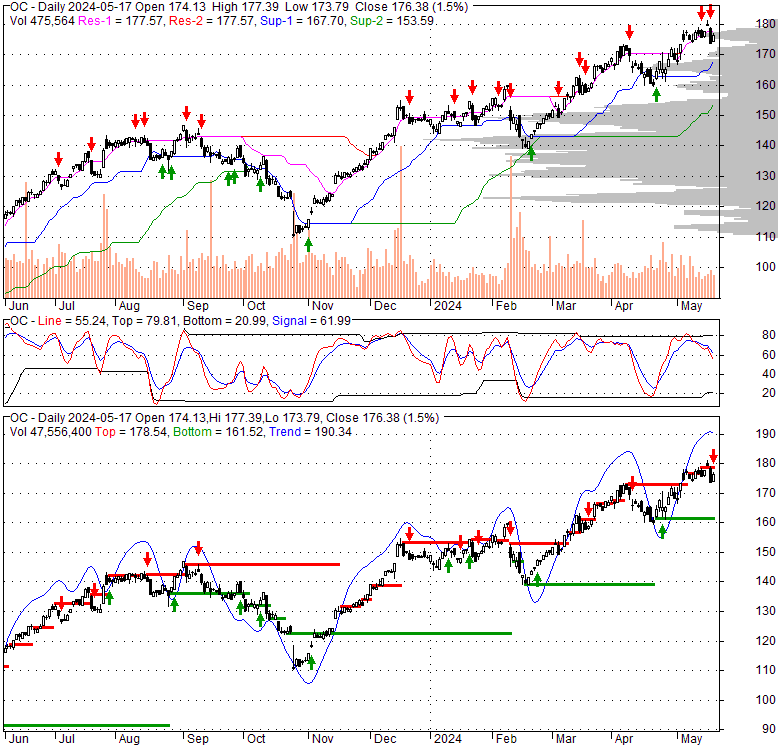
| Price has closed above its short-term moving average. Short-term moving average is currently above mid-term; and above long-term moving average. From the relationship between price and moving averages: This stock is BULLISH in short-term; and BULLISH in mid-long term.[ OC ] has closed below upper band by 0.5%. Bollinger Bands are 15.5% wider than normal. The current width of the bands does not suggest anything about the future direction or movement of prices. |
| Company profile |
|---|
| Owens Corning manufactures and markets insulation, roofing, and fiberglass composite materials in the United States, Canada, Europe, the Asia Pacific, and internationally. It operates in three segments: Composites, Insulation, and Roofing. The Composites segment manufactures, fabricates, and sells glass reinforcements in the form of fiber; and glass fiber products in the form of fabrics, non-wovens, and other specialized products. Its products are used in building structures, roofing shingles, tubs and showers, pools, flooring, pipes and tanks, poles, electrical equipment, and wind-energy turbine blades applications in the building and construction, renewable energy, and infrastructure markets. This segment sells its products directly to parts molders, fabricators, and shingle manufacturers. The Insulation segment manufactures and sells insulation products for residential, commercial, industrial, and other markets for thermal and acoustical applications; and glass fiber pipe insulation, flexible duct media, bonded and granulated mineral fiber insulation, cellular glass insulation, and foam insulation products used in construction applications. This segment sells its products primarily to the insulation installers, home centers, lumberyards, retailers, and distributors under the Thermafiber, FOAMULAR, FOAMGLAS, Paroc, Owens Corning PINK, and FIBERGLAS Insulation brand names. The Roofing segment manufactures and sells aminate and strip asphalt roofing shingles, oxidized asphalt materials, and roofing components used in residential and commercial construction, and specialty applications, as well as synthetic packaging materials. This segment sells its products through distributors, home centers, lumberyards, retailers, and contractors, as well as to roofing contractors for built-up roofing asphalt systems; and manufacturers in automotive, chemical, rubber, and construction industries. Owens Corning was incorporated in 1938 and is headquartered in Toledo, Ohio. |
| Stock chart |
|---|
 |
| Financial Analysis | |
|---|---|
| Price to Book Value: | Outperform |
| P/BV, a ratio used to compare book value to its current market price, to gauge whether a stock is valued properly. | |
| Price to Earnings: | Underperform |
| PE, the ratio for valuing a company that measures its current share price relative to its earnings per share (EPS). | |
| Discounted cash flow: | Outperform |
| DCF, a valuation method used to estimate the value of an investment based on its expected future cash flows. | |
| Return on Assets: | Outperform |
| ROA, indicates how profitable a company is in relation to its total assets, how efficiently uses assets to generate a profit. | |
| Return on Equity: | Outperform |
| ROE, a measure of financial performance calculated by dividing net income by equity. a gauge of profitability and efficiency. | |
| Debt to Equity: | Outperform |
| evaluate financial leverage, reflects the ability of equity to cover outstanding debts in the event of a business downturn. | |
| Stock Basics & Statistics | |
|---|---|
| Exchange: New York Stock Exchange | |
| Sector: Industrials | |
| Industry: Construction | |
| Shares Out. (M) | 86.99 |
| Shares Float (M) | 86.35 |
| % Held by Insiders | 0.91 |
| % Held by Institutions | 97.26 |
| Shares Short (K) | 1790 |
| Shares Short Prior Month (K) | 1630 |
| Stock Financials | |
|---|---|
| EPS | 13.150 |
| Book Value (p.s.) | 59.240 |
| Profit Margin | 12.36 |
| Operating Margin | 19.18 |
| Return on Assets (ttm) | 9.4 |
| Return on Equity (ttm) | 24.3 |
| Qtrly Rev. Growth | 0.8 |
| Gross Profit (p.s.) | |
| Sales Per Share | 111.277 |
| EBITDA (p.s.) | 24.830 |
| Qtrly Earnings Growth | 11.40 |
| Operating Cash Flow (M) | 1720.00 |
| Levered Free Cash Flow (M) | 977.50 |
| Stock Valuation | |
|---|---|
| PE Ratio | 13.29 |
| PEG Ratio | 1.49 |
| Price to Book value | 2.95 |
| Price to Sales | 1.57 |
| Price to Cash Flow | 8.84 |
| Stock Dividends | |
|---|---|
| Dividend | |
| Dividend Yield | |
| Dividend Growth | |