| Oge Energy Corp (OGE) | |||
|---|---|---|---|
| 34.48 0.16 (0.47%) | 04-25 16:00 | ||
| Open: | 34.18 | Pre. Close: | 34.32 |
| High: | 34.525 | Low: | 34.12 |
| Volume: | 1,901,097 | Market Cap: | 6,907(M) |
| Stock Technical Analysis | |
|---|---|
| Overall: |  |
| Target: | Six months: 40.53 One year: 47.34 |
| Support: | Support1: 33.26 Support2: 32.37 |
| Resistance: | Resistance1: 34.70 Resistance2: 40.53 |
| Pivot: | 33.55 |
| Moving Averages: | MA(5): 34.16 MA(20): 33.75 MA(100): 33.96 MA(250): 34.68 |
| MACD: | MACD(12,26): 0.10 Signal(12,26,9): -0.02 |
| %K %D: | %K(14,3): 84.26 %D(3): 76.85 |
| RSI: | RSI(14): 60.15 |
| 52-Week: | High: 38.04 Low: 31.25 Change(%): -8.6 |
| Average Vol(K): | 3-Month: 1574 10-Days: 1556 |
| Prices Prediction (Update @5:00pm) | ||
|---|---|---|
| If tomorrow: | Open lower | Open higher |
| High: | 34.562 - 34.695 | 34.695 - 34.848 |
| Low: | 33.754 - 33.898 | 33.898 - 34.064 |
| Close: | 34.211 - 34.443 | 34.443 - 34.71 |
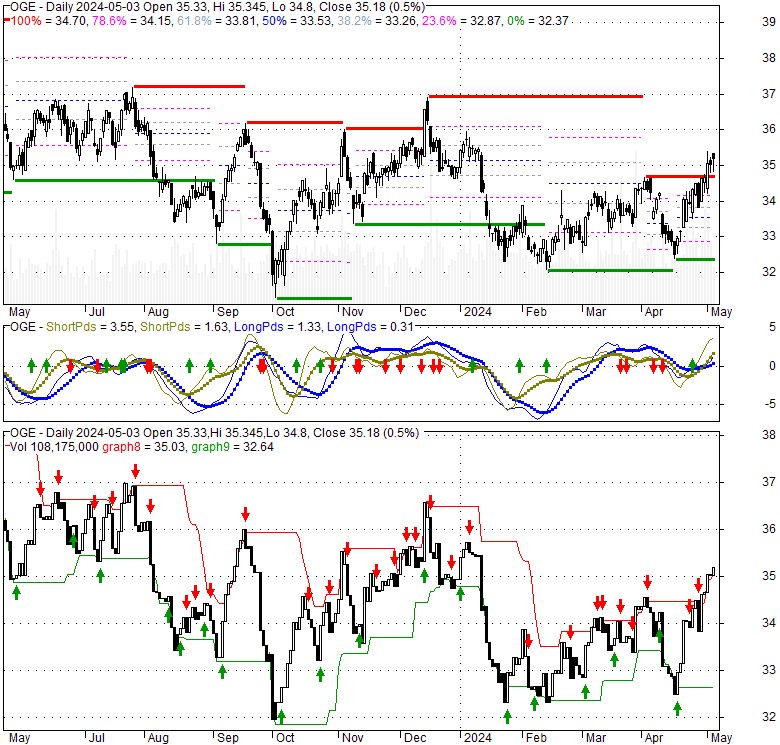
| Price, MAs and Bollinger Bands |
|---|
| Price has closed above its short-term moving average. Short-term moving average is currently above mid-term; and above long-term moving average. From the relationship between price and moving averages: This stock is BULLISH in short-term; and NEUTRAL in mid-long term.[ OGE ] has closed below upper band by 12.6%. Bollinger Bands are 28.5% wider than normal. The current width of the bands does not suggest anything about the future direction or movement of prices. |
| Company profile |
|---|
| OGE Energy Corp., together with its subsidiaries, operates as an energy and energy services provider that offers physical delivery and related services for electricity, natural gas, crude oil, and natural gas liquids in the United States. The company generates, transmits, distributes, and sells electric energy. It provides retail electric service to approximately 879,000 customers, which covers a service area of approximately 30,000 square miles in Oklahoma and western Arkansas; and owns and operates coal-fired, natural gas-fired, wind-powered, and solar-powered generating assets. As of December 31, 2021, the company owned and operated interconnected electric generation, transmission, and distribution systems, including 16 generating stations with an aggregate capability of 7,207 megawatts; and transmission systems comprising 54 substations and 5,122 structure miles of lines in Oklahoma, and 7 substations and 277 structure miles of lines in Arkansas. Its distribution systems included 350 substations; 29,494 structure miles of overhead lines; 3,365 miles of underground conduit; and 11,125 miles of underground conductors in Oklahoma, as well as 29 substations, 2,795 structure miles of overhead lines, 349 miles of underground conduit, and 662 miles of underground conductors in Arkansas. The company was founded in 1902 and is based in Oklahoma City, Oklahoma. |
| Stock chart |
|---|
 |
| Financial Analysis | |
|---|---|
| Price to Book Value: | Outperform |
| P/BV, a ratio used to compare book value to its current market price, to gauge whether a stock is valued properly. | |
| Price to Earnings: | Outperform |
| PE, the ratio for valuing a company that measures its current share price relative to its earnings per share (EPS). | |
| Discounted cash flow: | Outperform |
| DCF, a valuation method used to estimate the value of an investment based on its expected future cash flows. | |
| Return on Assets: | Underperform |
| ROA, indicates how profitable a company is in relation to its total assets, how efficiently uses assets to generate a profit. | |
| Return on Equity: | Underperform |
| ROE, a measure of financial performance calculated by dividing net income by equity. a gauge of profitability and efficiency. | |
| Debt to Equity: | Neutral |
| evaluate financial leverage, reflects the ability of equity to cover outstanding debts in the event of a business downturn. | |
| Stock Basics & Statistics | |
|---|---|
| Exchange: New York Stock Exchange | |
| Sector: Utilities | |
| Industry: Regulated Electric | |
| Shares Out. (M) | 200.55 |
| Shares Float (M) | 199.26 |
| % Held by Insiders | 0.32 |
| % Held by Institutions | 74.22 |
| Shares Short (K) | 5810 |
| Shares Short Prior Month (K) | 4540 |
| Stock Financials | |
|---|---|
| EPS | 2.070 |
| Book Value (p.s.) | 22.520 |
| Profit Margin | 15.58 |
| Operating Margin | 17.24 |
| Return on Assets (ttm) | 3.2 |
| Return on Equity (ttm) | 9.3 |
| Qtrly Rev. Growth | -20.4 |
| Gross Profit (p.s.) | |
| Sales Per Share | 13.313 |
| EBITDA (p.s.) | 5.635 |
| Qtrly Earnings Growth | -4.50 |
| Operating Cash Flow (M) | 1230.00 |
| Levered Free Cash Flow (M) | -36.04 |
| Stock Valuation | |
|---|---|
| PE Ratio | 16.66 |
| PEG Ratio | -1.26 |
| Price to Book value | 1.53 |
| Price to Sales | 2.59 |
| Price to Cash Flow | 5.62 |
| Stock Dividends | |
|---|---|
| Dividend | |
| Dividend Yield | |
| Dividend Growth | |


