| Oil States International (OIS) | |||
|---|---|---|---|
| 4.42 -0.09 (-2%) | 05-08 16:00 | ||
| Open: | 4.49 | Pre. Close: | 4.51 |
| High: | 4.52 | Low: | 4.42 |
| Volume: | 1,150,927 | Market Cap: | 284(M) |
| Stock Technical Analysis | |
|---|---|
| Overall: |  |
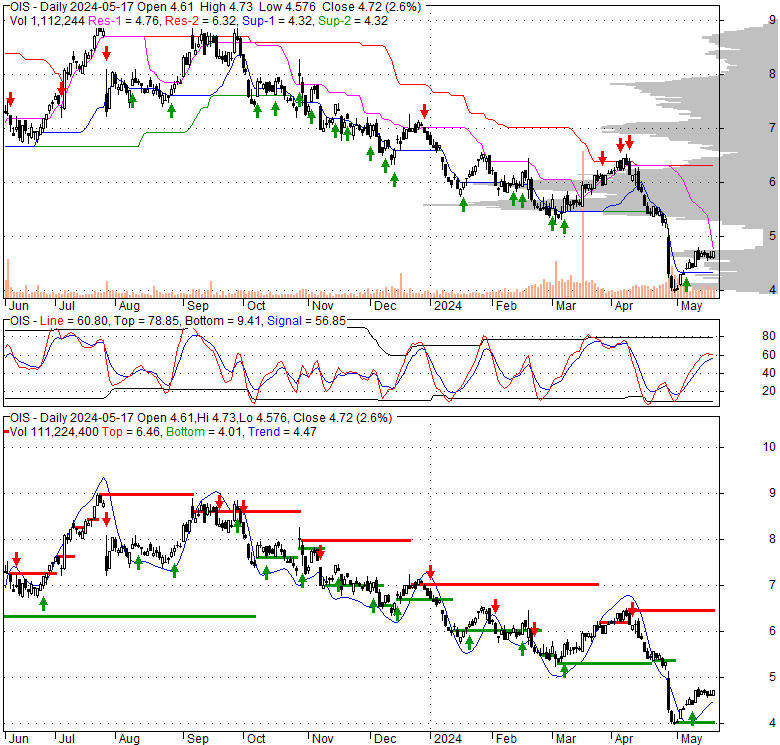
| Target: | Six months: 6.48 One year: 7.63 |
| Support: | Support1: 3.95 Support2: 3.29 |
| Resistance: | Resistance1: 5.54 Resistance2: 6.53 |
| Pivot: | 4.72 |
| Moving Averages: | MA(5): 4.39 MA(20): 4.98 MA(100): 5.90 MA(250): 6.90 |
| MACD: | MACD(12,26): -0.42 Signal(12,26,9): -0.39 |
| %K %D: | %K(14,3): 28.74 %D(3): 24.33 |
| RSI: | RSI(14): 34.27 |
| 52-Week: | High: 9.02 Low: 3.95 Change(%): -36.5 |
| Average Vol(K): | 3-Month: 1756 10-Days: 2302 |
| Prices Prediction (Update @5:00pm) | ||
|---|---|---|
| If tomorrow: | Open lower | Open higher |
| High: | 4.524 - 4.547 | 4.547 - 4.561 |
| Low: | 4.365 - 4.396 | 4.396 - 4.415 |
| Close: | 4.377 - 4.422 | 4.422 - 4.451 |
| Price, MAs and Bollinger Bands |
|---|
| Price has closed above its short-term moving average. Short-term moving average is currently below mid-term; and below long-term moving average. From the relationship between price and moving averages: This stock is NEUTRAL in short-term; and BEARISH in mid-long term.[ OIS ] has closed above bottom band by 37.2%. Bollinger Bands are 123% wider than normal. The large width of the bands suggest high volatility as compared to its normal range. The bands have been in this wide range for 14 days. This is a sign that the current trend might continue. |
| Company profile |
|---|
| Oil States International, Inc., through its subsidiaries, provides oilfield products and services for the drilling, completion, subsea, production, and infrastructure sectors of the oil and gas industry worldwide. The company operates through three segments: Well Site Services, Downhole Technologies, and Offshore/Manufactured Products. The Well Site Services segment offers a range of equipment and services that are used to drill for, establish, and maintain the flow of oil and natural gas from a well throughout its lifecycle. It also provides wellhead isolation, frac valve, wireline and coiled tubing support, flowback and well testing, pipe recovery systems, gravel pack and sand control, blowout preventer, and drilling services. The Downhole Technologies segment provides oil and gas perforation systems, and downhole tools in support of completion, intervention, wireline, and well abandonment operations. This segment also designs, manufactures, and markets its consumable engineered products to oilfield service, and exploration and production companies. The Offshore/Manufactured Products segment designs, manufactures, and markets capital equipment utilized on floating production systems, subsea pipeline infrastructure, and offshore drilling rigs and vessels; and short-cycle and other products. Its products include flexible bearings, advanced connector systems, high-pressure riser systems, deepwater mooring systems, cranes, subsea pipeline products, and blow-out preventer stack integration products. This segment also provides short-cycle products, such as valves, elastomers, and other specialty products that are used in the land-based drilling and completion markets; and other products for use in industrial, military, and other applications. In addition, it offers specialty welding, fabrication, cladding and machining, offshore installation, and inspection and repair services. The company was incorporated in 1995 and is headquartered in Houston, Texas. |
| Stock chart |
|---|
 |
| Financial Analysis | |
|---|---|
| Price to Book Value: | Underperform |
| P/BV, a ratio used to compare book value to its current market price, to gauge whether a stock is valued properly. | |
| Price to Earnings: | Underperform |
| PE, the ratio for valuing a company that measures its current share price relative to its earnings per share (EPS). | |
| Discounted cash flow: | Outperform |
| DCF, a valuation method used to estimate the value of an investment based on its expected future cash flows. | |
| Return on Assets: | Underperform |
| ROA, indicates how profitable a company is in relation to its total assets, how efficiently uses assets to generate a profit. | |
| Return on Equity: | Underperform |
| ROE, a measure of financial performance calculated by dividing net income by equity. a gauge of profitability and efficiency. | |
| Debt to Equity: | Neutral |
| evaluate financial leverage, reflects the ability of equity to cover outstanding debts in the event of a business downturn. | |
| Stock Basics & Statistics | |
|---|---|
| Exchange: New York Stock Exchange | |
| Sector: Energy | |
| Industry: Oil & Gas Equipment & Services | |
| Shares Out. (M) | 64.22 |
| Shares Float (M) | 60.74 |
| % Held by Insiders | 5.32 |
| % Held by Institutions | 91.72 |
| Shares Short (K) | 1590 |
| Shares Short Prior Month (K) | 3710 |
| Stock Financials | |
|---|---|
| EPS | -0.040 |
| Book Value (p.s.) | 10.780 |
| Profit Margin | -0.35 |
| Operating Margin | -0.82 |
| Return on Assets (ttm) | 0.9 |
| Return on Equity (ttm) | -0.4 |
| Qtrly Rev. Growth | -14.7 |
| Gross Profit (p.s.) | |
| Sales Per Share | 11.731 |
| EBITDA (p.s.) | 1.166 |
| Qtrly Earnings Growth | |
| Operating Cash Flow (M) | 51.13 |
| Levered Free Cash Flow (M) | -0.32 |
| Stock Valuation | |
|---|---|
| PE Ratio | -110.50 |
| PEG Ratio | -2.79 |
| Price to Book value | 0.41 |
| Price to Sales | 0.38 |
| Price to Cash Flow | 5.55 |
| Stock Dividends | |
|---|---|
| Dividend | |
| Dividend Yield | |
| Dividend Growth | |


