| Ollies Bargain CS (OLLI) | |||
|---|---|---|---|
| 74.46 0.11 (0.15%) | 04-26 16:00 | ||
| Open: | 74.32 | Pre. Close: | 74.35 |
| High: | 75.04 | Low: | 73.51 |
| Volume: | 562,367 | Market Cap: | 4,569(M) |
| Stock Technical Analysis | |
|---|---|
| Overall: |  |
| Target: | Six months: 93.58 One year: 109.30 |
| Support: | Support1: 72.66 Support2: 68.05 |
| Resistance: | Resistance1: 80.12 Resistance2: 93.58 |
| Pivot: | 73.11 |
| Moving Averages: | MA(5): 74.49 MA(20): 72.77 MA(100): 74.56 MA(250): 72.24 |
| MACD: | MACD(12,26): -0.26 Signal(12,26,9): -0.66 |
| %K %D: | %K(14,3): 79.16 %D(3): 83.58 |
| RSI: | RSI(14): 51.60 |
| 52-Week: | High: 84.38 Low: 52.93 Change(%): 14.1 |
| Average Vol(K): | 3-Month: 940 10-Days: 824 |
| Prices Prediction (Update @5:00pm) | ||
|---|---|---|
| If tomorrow: | Open lower | Open higher |
| High: | 75.078 - 75.448 | 75.448 - 75.823 |
| Low: | 72.637 - 73.022 | 73.022 - 73.412 |
| Close: | 73.842 - 74.451 | 74.451 - 75.068 |
| Price, MAs and Bollinger Bands |
|---|
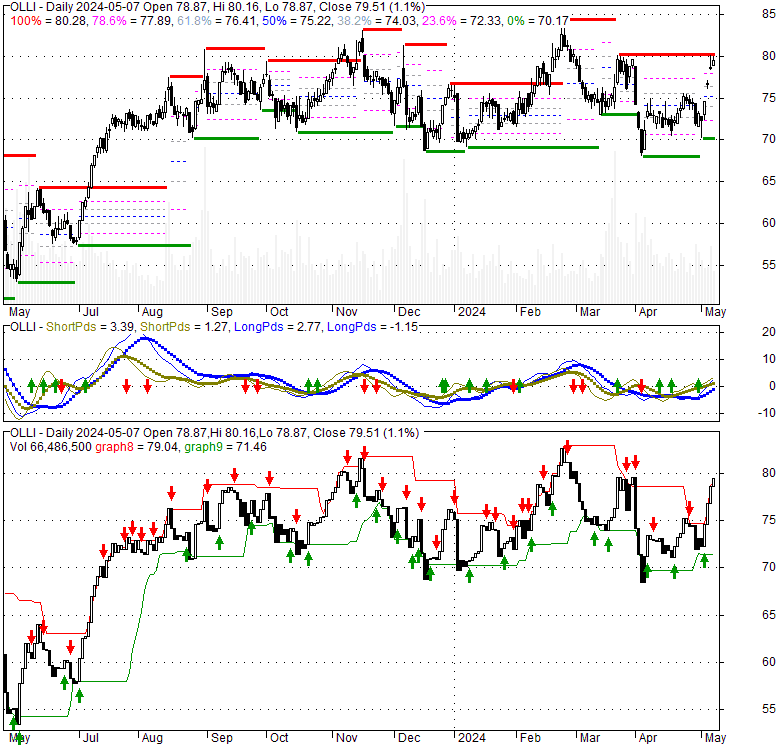
| Price has closed below its short-term moving average. Short-term moving average is currently below mid-term; and below long-term moving average. From the relationship between price and moving averages: This stock is BEARISH in short-term; and NEUTRAL in mid-long term.[ OLLI ] has closed below upper band by 20.8%. Bollinger Bands are 44.6% narrower than normal. The narrow width of the bands suggests low volatility as compared to its normal range. The bands have been in this narrow range for 2 bars. This is a sign that the market may be about to initiate a new trend. |
| Company profile |
|---|
| Ollie's Bargain Outlet Holdings, Inc. operates as a retailer of brand name merchandise. The company offers housewares, bed and bath, food, floor coverings, health and beauty aids, books and stationery, toys, and electronics; and other products, including hardware, candy, clothing, sporting goods, pet and lawn, and garden products. It provides its products primarily under the Ollie's, Ollie's Bargain Outlet, Good Stuff Cheap, Ollie's Army, Real Brands Real Cheap!, Real Brands! Real Bargains, Sarasota Breeze, Steelton Tools, American Way, and Middleton Home names. As of August 3, 2022, it operated 450 stores in 29 states throughout half of the United States. The company was formerly known as Bargain Holdings, Inc. and changed its name to Ollie's Bargain Outlet Holdings, Inc. in March 2015. Ollie's Bargain Outlet Holdings, Inc. was founded in 1982 and is headquartered in Harrisburg, Pennsylvania. |
| Stock chart |
|---|
 |
| Stock News |
|---|
|
Thu, 16 Feb 2023 See Inside Of The New Ollie's Bargain Outlet In Lake Charles [PHOTOS] - Gator 99.5 Tue, 04 Oct 2022 Pennsylvania store features the world's largest bobblehead | News | northcentralpa.com - NorthcentralPA.com Mon, 02 Dec 2019 Mark Butler, Founder Of Ollie's Bargain Outlet, Dies Unexpectedly At Age 61 - CBS News Fri, 11 Jan 2019 Ollie's Bargain Outlet Scoops Up Abandoned Toys R Us Stores - Fortune Fri, 26 Apr 2024 Fri, 26 Apr 2024 |
| Financial Analysis | |
|---|---|
| Price to Book Value: | Outperform |
| P/BV, a ratio used to compare book value to its current market price, to gauge whether a stock is valued properly. | |
| Price to Earnings: | Neutral |
| PE, the ratio for valuing a company that measures its current share price relative to its earnings per share (EPS). | |
| Discounted cash flow: | Outperform |
| DCF, a valuation method used to estimate the value of an investment based on its expected future cash flows. | |
| Return on Assets: | Outperform |
| ROA, indicates how profitable a company is in relation to its total assets, how efficiently uses assets to generate a profit. | |
| Return on Equity: | Outperform |
| ROE, a measure of financial performance calculated by dividing net income by equity. a gauge of profitability and efficiency. | |
| Debt to Equity: | Underperform |
| evaluate financial leverage, reflects the ability of equity to cover outstanding debts in the event of a business downturn. | |
| Stock Basics & Statistics | |
|---|---|
| Exchange: NASDAQ Global Market | |
| Sector: Consumer Defensive | |
| Industry: Discount Stores | |
| Shares Out. (M) | 61.37 |
| Shares Float (M) | 61.07 |
| % Held by Insiders | 0.38 |
| % Held by Institutions | 105.02 |
| Shares Short (K) | 3210 |
| Shares Short Prior Month (K) | 2620 |
| Stock Financials | |
|---|---|
| EPS | 2.920 |
| Book Value (p.s.) | 24.540 |
| Profit Margin | 8.63 |
| Operating Margin | 15.05 |
| Return on Assets (ttm) | 6.6 |
| Return on Equity (ttm) | 12.6 |
| Qtrly Rev. Growth | 18.0 |
| Gross Profit (p.s.) | |
| Sales Per Share | 34.219 |
| EBITDA (p.s.) | 4.281 |
| Qtrly Earnings Growth | 44.30 |
| Operating Cash Flow (M) | 254.50 |
| Levered Free Cash Flow (M) | 86.28 |
| Stock Valuation | |
|---|---|
| PE Ratio | 25.50 |
| PEG Ratio | 1.51 |
| Price to Book value | 3.03 |
| Price to Sales | 2.18 |
| Price to Cash Flow | 17.96 |
| Stock Dividends | |
|---|---|
| Dividend | |
| Dividend Yield | |
| Dividend Growth | |