| On Semiconductor (ON) | |||
|---|---|---|---|
| 70.37 0.36 (0.51%) | 05-03 16:00 | ||
| Open: | 71.65 | Pre. Close: | 70.01 |
| High: | 72.26 | Low: | 69.99 |
| Volume: | 6,236,410 | Market Cap: | 30,275(M) |
| Stock Technical Analysis | |
|---|---|
| Overall: |  |
| Target: | Six months: 87.47 One year: 102.17 |
| Support: | Support1: 65.28 Support2: 59.34 |
| Resistance: | Resistance1: 74.89 Resistance2: 87.47 |
| Pivot: | 66.08 |
| Moving Averages: | MA(5): 70.07 MA(20): 66.86 MA(100): 75.27 MA(250): 82.89 |
| MACD: | MACD(12,26): -0.65 Signal(12,26,9): -1.71 |
| %K %D: | %K(14,3): 77.98 %D(3): 78.88 |
| RSI: | RSI(14): 54.02 |
| 52-Week: | High: 111.35 Low: 59.34 Change(%): -13.4 |
| Average Vol(K): | 3-Month: 6891 10-Days: 9220 |
| Prices Prediction (Update @5:00pm) | ||
|---|---|---|
| If tomorrow: | Open lower | Open higher |
| High: | 72.327 - 72.605 | 72.605 - 72.925 |
| Low: | 69.239 - 69.535 | 69.535 - 69.876 |
| Close: | 69.821 - 70.295 | 70.295 - 70.839 |
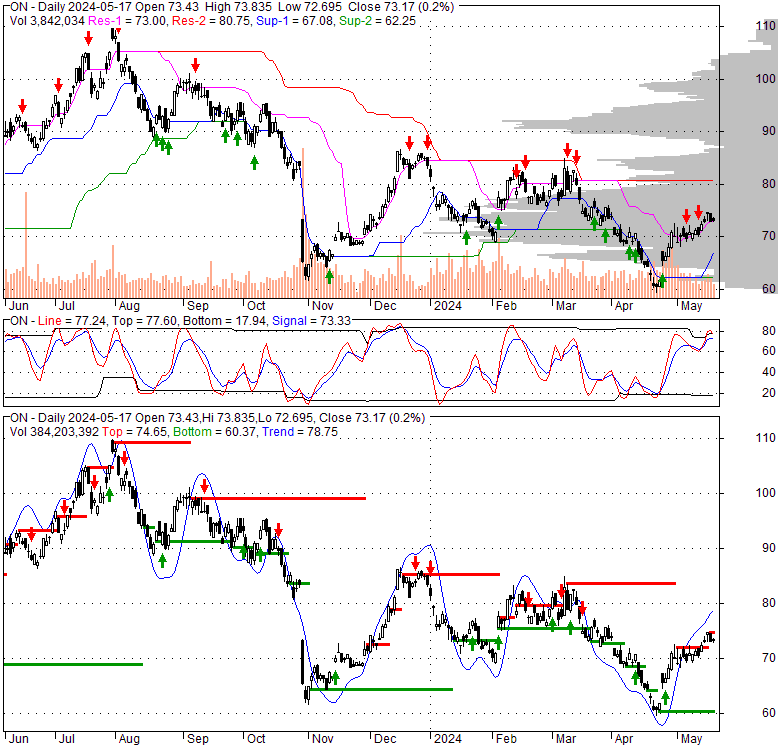
| Price, MAs and Bollinger Bands |
|---|
| Price has closed above its short-term moving average. Short-term moving average is currently below mid-term; and below long-term moving average. From the relationship between price and moving averages: This stock is NEUTRAL in short-term; and BEARISH in mid-long term.[ ON ] has closed below upper band by 18.8%. Bollinger Bands are 15.5% wider than normal. The current width of the bands does not suggest anything about the future direction or movement of prices. |
| Company profile |
|---|
| ON Semiconductor Corporation provides intelligent sensing and power solutions worldwide. Its intelligent power technologies enable the electrification of the automotive industry that allows for lighter and longer-range electric vehicles, empowers fast-charging systems, and propels sustainable energy for the solar strings, industrial power, and storage systems. The company operates through three segments the Power Solutions Group, the Advanced Solutions Group, and the Intelligent Sensing Group segments. It offers analog, discrete, module, and integrated semiconductor products that perform multiple application functions, including power switching and conversion, signal conditioning, circuit protection, signal amplification, and voltage regulation functions. The company also designs and develops analog, mixed-signal, advanced logic, application specific standard product and ASICs, radio frequency, and integrated power solutions for end-users in end-markets, as well as provides foundry and design services for government customers. In addition, it develops complementary metal oxide semiconductor image sensors, image signal processors, and single photon detectors, including silicon photomultipliers and single photon avalanche diode arrays, as well as actuator drivers for autofocus and image stabilization for a broad base of end-users in various end-markets. ON Semiconductor Corporation was incorporated in 1992 and is headquartered in Phoenix, Arizona. |
| Stock chart |
|---|
 |
| Financial Analysis | |
|---|---|
| Price to Book Value: | Outperform |
| P/BV, a ratio used to compare book value to its current market price, to gauge whether a stock is valued properly. | |
| Price to Earnings: | Neutral |
| PE, the ratio for valuing a company that measures its current share price relative to its earnings per share (EPS). | |
| Discounted cash flow: | Neutral |
| DCF, a valuation method used to estimate the value of an investment based on its expected future cash flows. | |
| Return on Assets: | Outperform |
| ROA, indicates how profitable a company is in relation to its total assets, how efficiently uses assets to generate a profit. | |
| Return on Equity: | Outperform |
| ROE, a measure of financial performance calculated by dividing net income by equity. a gauge of profitability and efficiency. | |
| Debt to Equity: | Outperform |
| evaluate financial leverage, reflects the ability of equity to cover outstanding debts in the event of a business downturn. | |
| Stock Basics & Statistics | |
|---|---|
| Exchange: NASDAQ Global Select | |
| Sector: Technology | |
| Industry: Semiconductors | |
| Shares Out. (M) | 429.85 |
| Shares Float (M) | 425.42 |
| % Held by Insiders | 0.34 |
| % Held by Institutions | 101.97 |
| Shares Short (K) | 22610 |
| Shares Short Prior Month (K) | 20440 |
| Stock Financials | |
|---|---|
| EPS | 4.890 |
| Book Value (p.s.) | 18.250 |
| Profit Margin | 26.46 |
| Operating Margin | 30.71 |
| Return on Assets (ttm) | 12.9 |
| Return on Equity (ttm) | 31.2 |
| Qtrly Rev. Growth | -4.1 |
| Gross Profit (p.s.) | |
| Sales Per Share | 19.193 |
| EBITDA (p.s.) | 7.491 |
| Qtrly Earnings Growth | -5.20 |
| Operating Cash Flow (M) | 1980.00 |
| Levered Free Cash Flow (M) | -409.95 |
| Stock Valuation | |
|---|---|
| PE Ratio | 14.39 |
| PEG Ratio | 3.18 |
| Price to Book value | 3.86 |
| Price to Sales | 3.67 |
| Price to Cash Flow | 15.28 |
| Stock Dividends | |
|---|---|
| Dividend | |
| Dividend Yield | |
| Dividend Growth | |


