| Pacific Biosciences (PACB) | |||
|---|---|---|---|
| 1.83 0.07 (3.98%) | 05-03 16:00 | ||
| Open: | 1.8804 | Pre. Close: | 1.76 |
| High: | 2.045 | Low: | 1.75 |
| Volume: | 14,320,902 | Market Cap: | 490(M) |
| Stock Technical Analysis | |
|---|---|
| Overall: |  |
| Target: | Six months: 3.34 One year: 4.50 |
| Support: | Support1: 1.25 Support2: 1.04 |
| Resistance: | Resistance1: 2.86 Resistance2: 3.85 |
| Pivot: | 1.63 |
| Moving Averages: | MA(5): 1.71 MA(20): 2.07 MA(100): 5.50 MA(250): 8.56 |
| MACD: | MACD(12,26): -0.54 Signal(12,26,9): -0.64 |
| %K %D: | %K(14,3): 24.62 %D(3): 20.85 |
| RSI: | RSI(14): 35.09 |
| 52-Week: | High: 14.55 Low: 1.25 Change(%): -85.0 |
| Average Vol(K): | 3-Month: 10273 10-Days: 10328 |
| Prices Prediction (Update @5:00pm) | ||
|---|---|---|
| If tomorrow: | Open lower | Open higher |
| High: | 2.051 - 2.057 | 2.057 - 2.064 |
| Low: | 1.734 - 1.74 | 1.74 - 1.748 |
| Close: | 1.818 - 1.828 | 1.828 - 1.84 |
| Price, MAs and Bollinger Bands |
|---|
| Price has closed above its short-term moving average. Short-term moving average is currently below mid-term; and below long-term moving average. From the relationship between price and moving averages: This stock is NEUTRAL in short-term; and BEARISH in mid-long term.[ PACB ] has closed below upper band by 35.7%. Bollinger Bands are 38.2% narrower than normal. The current width of the bands does not suggest anything about the future direction or movement of prices. |
| Company profile |
|---|
| Pacific Biosciences of California, Inc. designs, develops, and manufactures sequencing systems to resolve genetically complex problems. The company provides PacBio's Systems, which conduct, monitor, and analyse biochemical sequencing reactions; consumable products, including single molecule real-time (SMRT) cells; and various reagent kits designed for specific workflow, such as template preparation kit to convert DNA into SMRTbell double-stranded DNA library formats, including molecular biology reagents, such as ligase, buffers, and exonucleases. It also offers binding kits, such as modified DNA polymerase used to bind SMRTbell libraries to the polymerase in preparation for sequencing; and sequencing kits comprise reagents required for on-instrument, real-time sequencing, including the phospholinked nucleotides. The company serves research institutions; commercial laboratories; genome centers; public health labs, hospitals and clinical research institutes, contract research organizations, and academic institutions; pharmaceutical companies; and agricultural companies. It markets its products through a direct sales force in North America and Europe, as well as through distribution partners in Asia, Europe, the Middle East, Africa, and Latin America. Pacific Biosciences of California, Inc. has a development and commercialization agreement with Invitae Corporation. The company was formerly known as Nanofluidics, Inc. and changed its name to Pacific Biosciences of California, Inc. in 2005. Pacific Biosciences of California, Inc. was incorporated in 2000 and is headquartered in Menlo Park, California. |
| Stock chart |
|---|
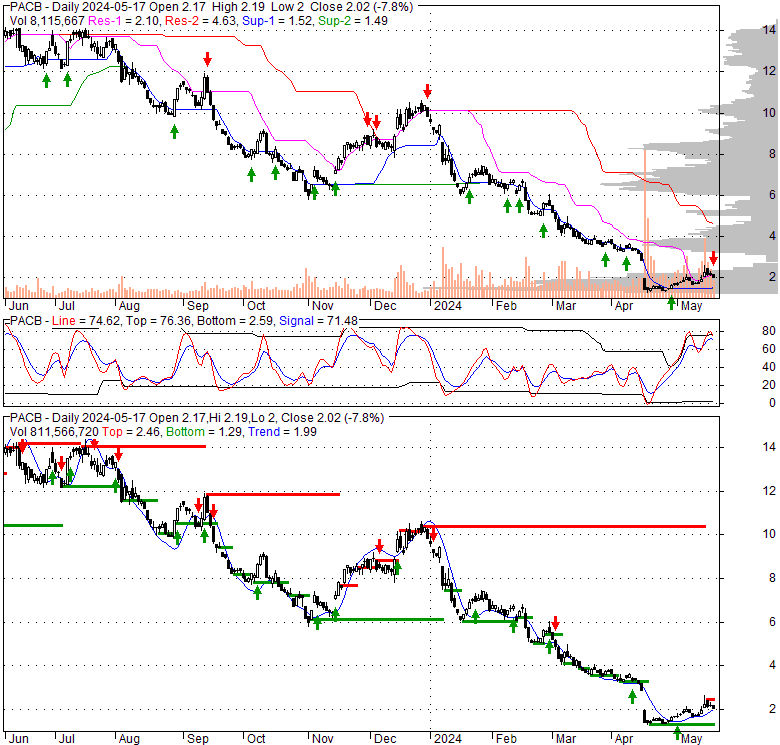 |
| Financial Analysis | |
|---|---|
| Price to Book Value: | Outperform |
| P/BV, a ratio used to compare book value to its current market price, to gauge whether a stock is valued properly. | |
| Price to Earnings: | Underperform |
| PE, the ratio for valuing a company that measures its current share price relative to its earnings per share (EPS). | |
| Discounted cash flow: | Outperform |
| DCF, a valuation method used to estimate the value of an investment based on its expected future cash flows. | |
| Return on Assets: | Underperform |
| ROA, indicates how profitable a company is in relation to its total assets, how efficiently uses assets to generate a profit. | |
| Return on Equity: | Underperform |
| ROE, a measure of financial performance calculated by dividing net income by equity. a gauge of profitability and efficiency. | |
| Debt to Equity: | Outperform |
| evaluate financial leverage, reflects the ability of equity to cover outstanding debts in the event of a business downturn. | |
| Stock Basics & Statistics | |
|---|---|
| Exchange: NASDAQ Global Select | |
| Sector: Healthcare | |
| Industry: Medical - Devices | |
| Shares Out. (M) | 267.95 |
| Shares Float (M) | 266.46 |
| % Held by Insiders | 2.80 |
| % Held by Institutions | 101.25 |
| Shares Short (K) | 49050 |
| Shares Short Prior Month (K) | 43540 |
| Stock Financials | |
|---|---|
| EPS | -1.210 |
| Book Value (p.s.) | 2.620 |
| Profit Margin | -152.97 |
| Operating Margin | -142.14 |
| Return on Assets (ttm) | -10.9 |
| Return on Equity (ttm) | -48.5 |
| Qtrly Rev. Growth | 113.3 |
| Gross Profit (p.s.) | |
| Sales Per Share | 0.748 |
| EBITDA (p.s.) | -1.072 |
| Qtrly Earnings Growth | |
| Operating Cash Flow (M) | -259.17 |
| Levered Free Cash Flow (M) | -306.52 |
| Stock Valuation | |
|---|---|
| PE Ratio | -1.51 |
| PEG Ratio | 1.43 |
| Price to Book value | 0.70 |
| Price to Sales | 2.44 |
| Price to Cash Flow | -1.89 |
| Stock Dividends | |
|---|---|
| Dividend | |
| Dividend Yield | |
| Dividend Growth | |


