| P10 Inc Cl A (PX) | |||
|---|---|---|---|
| 7.4 -0.19 (-2.5%) | 04-25 16:00 | ||
| Open: | 7.59 | Pre. Close: | 7.59 |
| High: | 7.6 | Low: | 7.375 |
| Volume: | 1,074,848 | Market Cap: | 857(M) |
| Stock Technical Analysis | |
|---|---|
| Overall: |  |
| Target: | Six months: 9.46 One year: 10.00 |
| Support: | Support1: 7.34 Support2: 6.11 |
| Resistance: | Resistance1: 8.10 Resistance2: 8.56 |
| Pivot: | 7.72 |
| Moving Averages: | MA(5): 7.52 MA(20): 7.89 MA(100): 8.83 MA(250): 10.08 |
| MACD: | MACD(12,26): -0.24 Signal(12,26,9): -0.22 |
| %K %D: | %K(14,3): 15.60 %D(3): 17.26 |
| RSI: | RSI(14): 31.79 |
| 52-Week: | High: 13.41 Low: 7.13 Change(%): -26.7 |
| Average Vol(K): | 3-Month: 801 10-Days: 680 |
| Prices Prediction (Update @5:00pm) | ||
|---|---|---|
| If tomorrow: | Open lower | Open higher |
| High: | 7.598 - 7.639 | 7.639 - 7.674 |
| Low: | 7.279 - 7.331 | 7.331 - 7.374 |
| Close: | 7.322 - 7.401 | 7.401 - 7.466 |
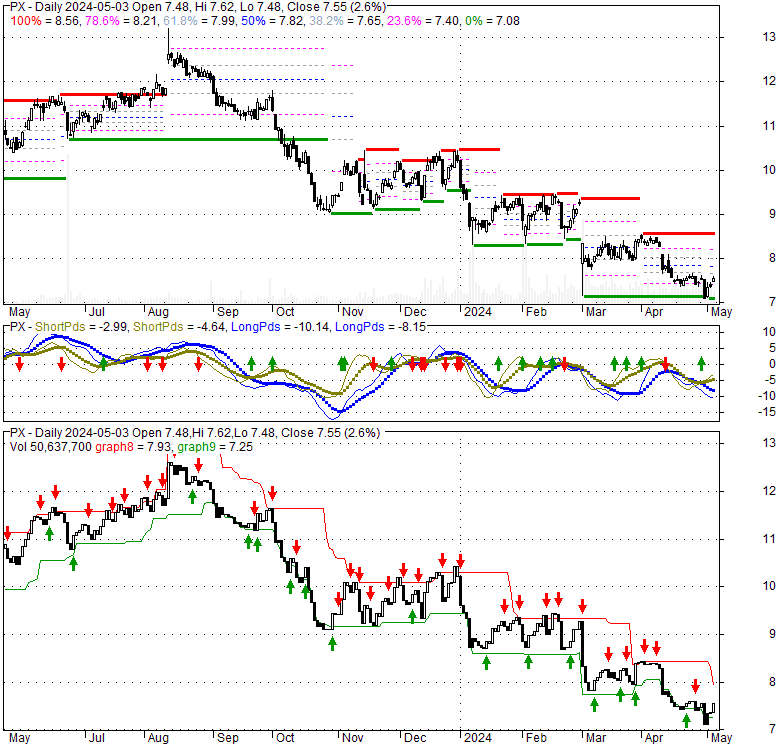
| Price, MAs and Bollinger Bands |
|---|
| Price has closed below its short-term moving average. Short-term moving average is currently below mid-term; and below long-term moving average. From the relationship between price and moving averages: This stock is BEARISH in short-term; and BEARISH in mid-long term.[ PX ] has closed above bottom band by 25.5%. Bollinger Bands are 10.3% wider than normal. The current width of the bands does not suggest anything about the future direction or movement of prices. |
| Company profile |
|---|
| P10, Inc., together with its subsidiaries, operates as a multi-asset class private market solutions provider in the alternative asset management industry in the United States. The company offers private equity, venture capital, private credit, impact investing, and private credit services, as well as primary fund of funds, secondary investment, and direct and co-investments services. It also provides tax credit transaction and consulting services. The company was founded in 1992 and is headquartered in Dallas, Texas. |
| Stock chart |
|---|
 |
| Financial Analysis | |
|---|---|
| Price to Book Value: | Outperform |
| P/BV, a ratio used to compare book value to its current market price, to gauge whether a stock is valued properly. | |
| Price to Earnings: | Underperform |
| PE, the ratio for valuing a company that measures its current share price relative to its earnings per share (EPS). | |
| Discounted cash flow: | Outperform |
| DCF, a valuation method used to estimate the value of an investment based on its expected future cash flows. | |
| Return on Assets: | Underperform |
| ROA, indicates how profitable a company is in relation to its total assets, how efficiently uses assets to generate a profit. | |
| Return on Equity: | Underperform |
| ROE, a measure of financial performance calculated by dividing net income by equity. a gauge of profitability and efficiency. | |
| Debt to Equity: | Outperform |
| evaluate financial leverage, reflects the ability of equity to cover outstanding debts in the event of a business downturn. | |
| Stock Basics & Statistics | |
|---|---|
| Exchange: New York Stock Exchange | |
| Sector: Financial Services | |
| Industry: Asset Management | |
| Shares Out. (M) | 57.43 |
| Shares Float (M) | 44.96 |
| % Held by Insiders | 21.37 |
| % Held by Institutions | 59.35 |
| Shares Short (K) | 2810 |
| Shares Short Prior Month (K) | 2910 |
| Stock Financials | |
|---|---|
| EPS | -0.060 |
| Book Value (p.s.) | 3.320 |
| Profit Margin | -2.95 |
| Operating Margin | -21.67 |
| Return on Assets (ttm) | 1.7 |
| Return on Equity (ttm) | -1.8 |
| Qtrly Rev. Growth | 8.1 |
| Gross Profit (p.s.) | |
| Sales Per Share | 4.209 |
| EBITDA (p.s.) | 0.922 |
| Qtrly Earnings Growth | |
| Operating Cash Flow (M) | 47.69 |
| Levered Free Cash Flow (M) | 77.97 |
| Stock Valuation | |
|---|---|
| PE Ratio | -123.33 |
| PEG Ratio | 0.64 |
| Price to Book value | 2.23 |
| Price to Sales | 1.76 |
| Price to Cash Flow | 8.91 |
| Stock Dividends | |
|---|---|
| Dividend | |
| Dividend Yield | |
| Dividend Growth | |


