| Pioneer Natural Resources Company (PXD) | |||
|---|---|---|---|
| 269.62 1.96 (0.73%) | 05-02 16:00 | ||
| Open: | 269.47 | Pre. Close: | 267.66 |
| High: | 272.23 | Low: | 269.141 |
| Volume: | 4,425,657 | Market Cap: | 63,003(M) |
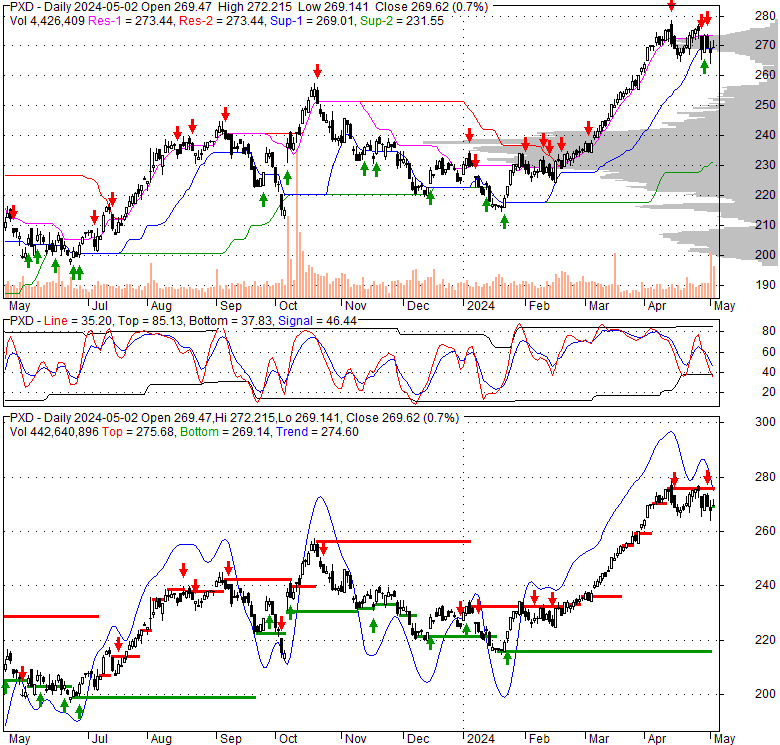
| Stock Technical Analysis | |
|---|---|
| Overall: |  |
| Target: | Six months: 325.67 One year: 380.39 |
| Support: | Support1: 267.34 Support2: 260.24 |
| Resistance: | Resistance1: 278.83 Resistance2: 325.67 |
| Pivot: | 270.77 |
| Moving Averages: | MA(5): 269.81 MA(20): 271.36 MA(100): 242.01 MA(250): 231.67 |
| MACD: | MACD(12,26): 3.26 Signal(12,26,9): 4.68 |
| %K %D: | %K(14,3): 32.81 %D(3): 38.54 |
| RSI: | RSI(14): 54.47 |
| 52-Week: | High: 278.83 Low: 196.745 Change(%): 30.8 |
| Average Vol(K): | 3-Month: 2033 10-Days: 2539 |
| Prices Prediction (Update @5:00pm) | ||
|---|---|---|
| If tomorrow: | Open lower | Open higher |
| High: | 272.619 - 274.146 | 274.146 - 275.543 |
| Low: | 265.041 - 267.073 | 267.073 - 268.933 |
| Close: | 266.716 - 269.621 | 269.621 - 272.281 |
| Price, MAs and Bollinger Bands |
|---|
| Price has closed below its short-term moving average. Short-term moving average is currently above mid-term; and above long-term moving average. From the relationship between price and moving averages: This stock is NEUTRAL in short-term; and BULLISH in mid-long term.[ PXD ] has closed above bottom band by 40.1%. Bollinger Bands are 34.3% narrower than normal. The current width of the bands does not suggest anything about the future direction or movement of prices. |
| Company profile |
|---|
| Pioneer Natural Resources Company operates as an independent oil and gas exploration and production company in the United States. The company explores for, develops, and produces oil, natural gas liquids (NGLs), and gas. It has operations in the Midland Basin in West Texas. As of December 31, 2021, the company had proved undeveloped reserves and proved developed non-producing reserves of 130 million barrels of oil, 92 million barrels of NGLs, and 462 billion cubic feet of gas; and owned interests in 11 gas processing plants. Pioneer Natural Resources Company was founded in 1997 and is headquartered in Irving, Texas. |
| Stock chart |
|---|
 |
| Financial Analysis | |
|---|---|
| Price to Book Value: | Outperform |
| P/BV, a ratio used to compare book value to its current market price, to gauge whether a stock is valued properly. | |
| Price to Earnings: | Outperform |
| PE, the ratio for valuing a company that measures its current share price relative to its earnings per share (EPS). | |
| Discounted cash flow: | Outperform |
| DCF, a valuation method used to estimate the value of an investment based on its expected future cash flows. | |
| Return on Assets: | Outperform |
| ROA, indicates how profitable a company is in relation to its total assets, how efficiently uses assets to generate a profit. | |
| Return on Equity: | Outperform |
| ROE, a measure of financial performance calculated by dividing net income by equity. a gauge of profitability and efficiency. | |
| Debt to Equity: | Neutral |
| evaluate financial leverage, reflects the ability of equity to cover outstanding debts in the event of a business downturn. | |
| Stock Basics & Statistics | |
|---|---|
| Exchange: New York Stock Exchange | |
| Sector: Energy | |
| Industry: Oil & Gas Exploration & Production | |
| Shares Out. (M) | 233.62 |
| Shares Float (M) | 231.67 |
| % Held by Insiders | 0.75 |
| % Held by Institutions | 81.86 |
| Shares Short (K) | 6370 |
| Shares Short Prior Month (K) | 5190 |
| Stock Financials | |
|---|---|
| EPS | 20.220 |
| Book Value (p.s.) | 99.180 |
| Profit Margin | 25.26 |
| Operating Margin | 34.16 |
| Return on Assets (ttm) | 11.1 |
| Return on Equity (ttm) | 21.4 |
| Qtrly Rev. Growth | -1.9 |
| Gross Profit (p.s.) | |
| Sales Per Share | 82.912 |
| EBITDA (p.s.) | 39.808 |
| Qtrly Earnings Growth | -11.90 |
| Operating Cash Flow (M) | 8450.00 |
| Levered Free Cash Flow (M) | 2510.00 |
| Stock Valuation | |
|---|---|
| PE Ratio | 13.33 |
| PEG Ratio | 6.39 |
| Price to Book value | 2.72 |
| Price to Sales | 3.25 |
| Price to Cash Flow | 7.45 |
| Stock Dividends | |
|---|---|
| Dividend | |
| Dividend Yield | |
| Dividend Growth | |


