| Rite Aid Corp (RAD) | |||
|---|---|---|---|
| 0.6483 -0.131 (-16.81%) | 10-13 16:00 | ||
| Open: | 0.7615 | Pre. Close: | 0.7793 |
| High: | 0.8 | Low: | 0.645 |
| Volume: | 2,433,445 | Market Cap: | 37(M) |
| Stock Technical Analysis | |
|---|---|
| Overall: |  |
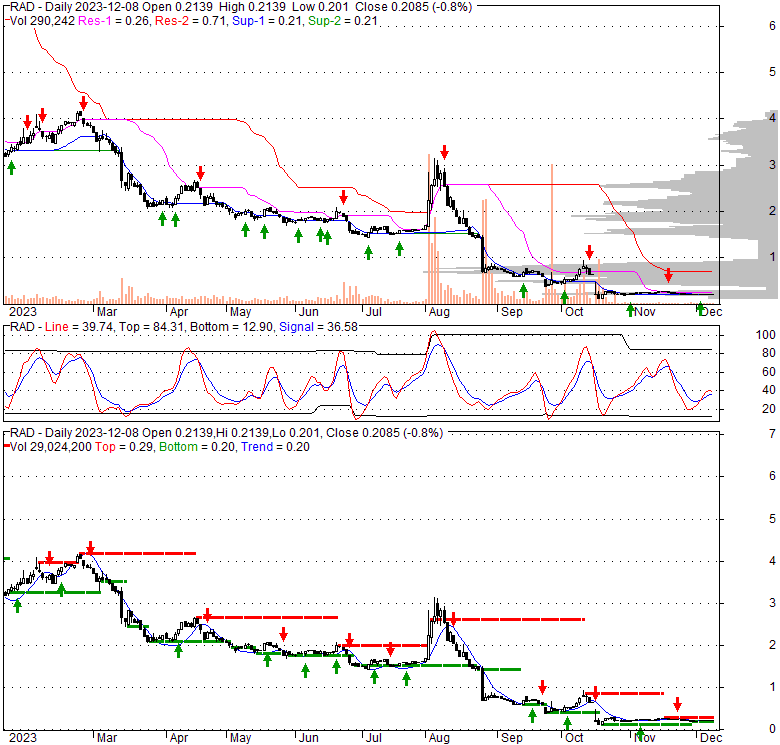
| Target: | Six months: 0.31 One year: 0.35 |
| Support: | Support1: 0.20 Support2: 0.17 |
| Resistance: | Resistance1: 0.26 Resistance2: 0.30 |
| Pivot: | 0.22 |
| Moving Averages: | MA(5): 0.21 MA(20): 0.23 MA(100): 0.81 MA(250): 1.94 |
| MACD: | MACD(12,26): -0.03 Signal(12,26,9): -0.04 |
| %K %D: | %K(14,3): 11.36 %D(3): 13.34 |
| RSI: | RSI(14): 37.19 |
| 52-Week: | High: 7.37 Low: 0.38 Change(%): -95.3 |
| Average Vol(K): | 3-Month: 3314 10-Days: 385 |
| Prices Prediction (Update @5:00pm) | ||
|---|---|---|
| If tomorrow: | Open lower | Open higher |
| High: | 0.21 - 0.212 | 0.212 - 0.213 |
| Low: | 0.196 - 0.198 | 0.198 - 0.2 |
| Close: | 0.207 - 0.21 | 0.21 - 0.212 |
| Price, MAs and Bollinger Bands |
|---|
| Price has closed below its short-term moving average. Short-term moving average is currently below mid-term; and below long-term moving average. From the relationship between price and moving averages: This stock is BEARISH in short-term; and BEARISH in mid-long term.[ RAD ] has closed above bottom band by 26.9%. Bollinger Bands are 92.3% narrower than normal. The narrow width of the bands suggests low volatility as compared to its normal range. The bands have been in this narrow range for 24 bars. This is a sign that the market may be about to initiate a new trend. |
| Company profile |
|---|
| Rite Aid Corporation, through its subsidiaries, operates a chain of retail drugstores in the United States. The company operates through two segments, Retail Pharmacy and Pharmacy Services. The Retail Pharmacy segment sells prescription drugs and provides various other pharmacy services and an assortment of products comprising over-the-counter medications, health and beauty aids, personal care products, seasonal merchandise, cosmetics, household items, food and beverages, greeting cards, seasonal and general merchandise, pet care, and a variety of other everyday and convenience products, as well as brand and generic prescription drugs; and a private brand product line. It also operates retail pharmacies and clinics; and offers healthcare services, including administering immunizations for COVID-19, the flu, shingles, and others; assists its customers with high blood pressure, cholesterol, and diabetes; provides guidance on combating obesity and tobacco addiction; and educates customers on managing medications and potential side effects. In addition, this segment offers healthcare coaching and disease management services to health plans and employers. The Pharmacy Services segment provides integrated suite of pharmacy benefit management (PBM) offerings, including technology solutions, mail delivery services, specialty pharmacy, network and rebate administration, claims adjudication, and pharmacy discount programs, as well as drug benefits under the federal government's Medicare Part D program and insurance offerings for individuals and groups. This segment serves health plans, commercial employers, labor groups, and state and local governments. As of February 26, 2022, the company operated 2,450 retail pharmacy locations in 17 states. Rite Aid Corporation was founded in 1962 and is headquartered in Philadelphia, Pennsylvania. |
| Stock chart |
|---|
 |
| Financial Analysis | |
|---|---|
| Price to Book Value: | Neutral |
| P/BV, a ratio used to compare book value to its current market price, to gauge whether a stock is valued properly. | |
| Price to Earnings: | Outperform |
| PE, the ratio for valuing a company that measures its current share price relative to its earnings per share (EPS). | |
| Discounted cash flow: | Outperform |
| DCF, a valuation method used to estimate the value of an investment based on its expected future cash flows. | |
| Return on Assets: | Underperform |
| ROA, indicates how profitable a company is in relation to its total assets, how efficiently uses assets to generate a profit. | |
| Return on Equity: | Outperform |
| ROE, a measure of financial performance calculated by dividing net income by equity. a gauge of profitability and efficiency. | |
| Debt to Equity: | Underperform |
| evaluate financial leverage, reflects the ability of equity to cover outstanding debts in the event of a business downturn. | |
| Stock Basics & Statistics | |
|---|---|
| Exchange: New York Stock Exchange | |
| Sector: Healthcare | |
| Industry: Medical - Pharmaceuticals | |
| Shares Out. (M) | 56.70 |
| Shares Float (M) | 54.03 |
| % Held by Insiders | 2.66 |
| % Held by Institutions | 49.33 |
| Shares Short (K) | 18070 |
| Shares Short Prior Month (K) | 11670 |
| Stock Financials | |
|---|---|
| EPS | -14.340 |
| Book Value (p.s.) | -17.170 |
| Profit Margin | -3.99 |
| Operating Margin | 0.04 |
| Return on Assets (ttm) | 0.1 |
| Return on Equity (ttm) | |
| Qtrly Rev. Growth | -6.0 |
| Gross Profit (p.s.) | 84.656 |
| Sales Per Share | 418.519 |
| EBITDA (p.s.) | 4.989 |
| Qtrly Earnings Growth | |
| Operating Cash Flow (M) | -172.74 |
| Levered Free Cash Flow (M) | -39.43 |
| Stock Valuation | |
|---|---|
| PE Ratio | -0.01 |
| PEG Ratio | 0.01 |
| Price to Book value | -0.01 |
| Price to Sales | |
| Price to Cash Flow | -0.07 |
| Stock Dividends | |
|---|---|
| Dividend | 2.300 |
| Dividend Yield | 11.03 |
| Dividend Growth | |


