| R1 Rcm Inc (RCM) | |||
|---|---|---|---|
| 12.47 0.02 (0.16%) | 05-03 16:00 | ||
| Open: | 12.68 | Pre. Close: | 12.45 |
| High: | 12.885 | Low: | 12.44 |
| Volume: | 941,117 | Market Cap: | 5,241(M) |
| Stock Technical Analysis | |
|---|---|
| Overall: |  |
| Target: | Six months: 15.35 One year: 17.93 |
| Support: | Support1: 12.12 Support2: 11.49 |
| Resistance: | Resistance1: 13.14 Resistance2: 15.35 |
| Pivot: | 12.12 |
| Moving Averages: | MA(5): 12.38 MA(20): 12.27 MA(100): 11.64 MA(250): 13.73 |
| MACD: | MACD(12,26): -0.10 Signal(12,26,9): -0.17 |
| %K %D: | %K(14,3): 70.67 %D(3): 65.84 |
| RSI: | RSI(14): 53.13 |
| 52-Week: | High: 18.705 Low: 8.87 Change(%): -23.3 |
| Average Vol(K): | 3-Month: 3368 10-Days: 1490 |
| Prices Prediction (Update @5:00pm) | ||
|---|---|---|
| If tomorrow: | Open lower | Open higher |
| High: | 12.905 - 12.955 | 12.955 - 13.005 |
| Low: | 12.311 - 12.37 | 12.37 - 12.429 |
| Close: | 12.376 - 12.465 | 12.465 - 12.554 |
| Price, MAs and Bollinger Bands |
|---|
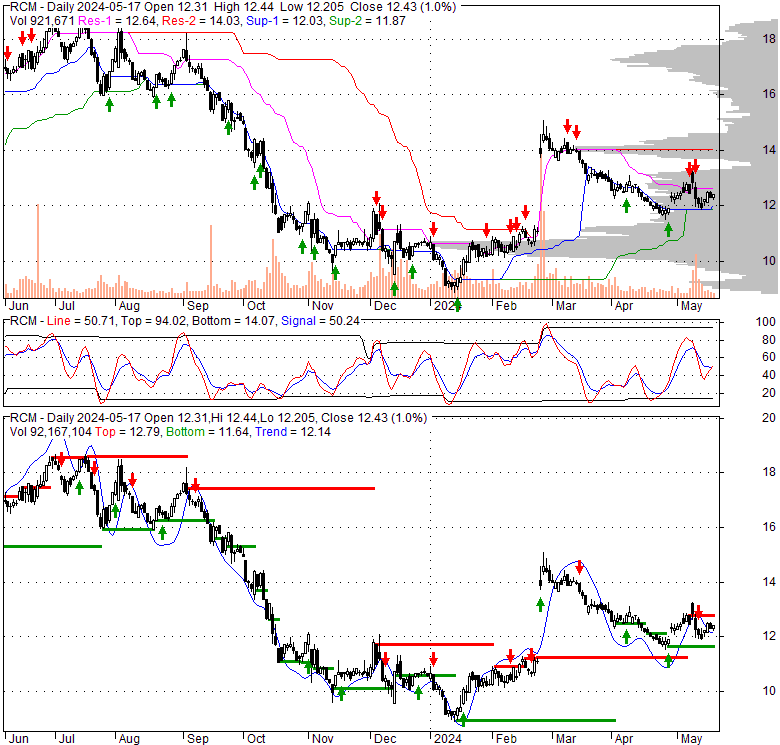
| Price has closed above its short-term moving average. Short-term moving average is currently below mid-term; and above long-term moving average. From the relationship between price and moving averages: This stock is NEUTRAL in short-term; and NEUTRAL in mid-long term.[ RCM ] has closed below upper band by 13.5%. Bollinger Bands are 51.8% narrower than normal. The narrow width of the bands suggests low volatility as compared to its normal range. The bands have been in this narrow range for 2 bars. This is a sign that the market may be about to initiate a new trend. |
| Company profile |
|---|
| R1 RCM Inc. provides technology-driven solutions that transform the patient experience and financial performance of hospitals, health systems, and medical groups. It offers end-to-end revenue cycle management (RCM) services, which address the spectrum of revenue cycle challenges faced by healthcare providers. The company also provides modular services, including physician advisory services, which assists healthcare organizations in complying with payer requirements regarding whether to classify a hospital visit as an in-patient or an out-patient observation case for billing purposes; practice management services that offers administrative and operational support for patient care and outsource non-core functions; revenue integrity solutions, including charge capture, charge description master maintenance, and pricing services; coding management services, such as business intelligence and analysis, human capital management, accountability framework, and quality management programs; patient experience; and business office services. In addition, the company offers software-as-a-service based scheduling and patient access solutions. The company was founded in 2003 and is headquartered in Murray, Utah. |
| Stock chart |
|---|
 |
| Financial Analysis | |
|---|---|
| Price to Book Value: | Neutral |
| P/BV, a ratio used to compare book value to its current market price, to gauge whether a stock is valued properly. | |
| Price to Earnings: | Outperform |
| PE, the ratio for valuing a company that measures its current share price relative to its earnings per share (EPS). | |
| Discounted cash flow: | Outperform |
| DCF, a valuation method used to estimate the value of an investment based on its expected future cash flows. | |
| Return on Assets: | Neutral |
| ROA, indicates how profitable a company is in relation to its total assets, how efficiently uses assets to generate a profit. | |
| Return on Equity: | Underperform |
| ROE, a measure of financial performance calculated by dividing net income by equity. a gauge of profitability and efficiency. | |
| Debt to Equity: | Outperform |
| evaluate financial leverage, reflects the ability of equity to cover outstanding debts in the event of a business downturn. | |
| Stock Basics & Statistics | |
|---|---|
| Exchange: NASDAQ Global Select | |
| Sector: Healthcare | |
| Industry: Medical - Healthcare Information Services | |
| Shares Out. (M) | 420.73 |
| Shares Float (M) | 291.76 |
| % Held by Insiders | 1.08 |
| % Held by Institutions | 103.43 |
| Shares Short (K) | 11960 |
| Shares Short Prior Month (K) | 17490 |
| Stock Financials | |
|---|---|
| EPS | 0.010 |
| Book Value (p.s.) | 6.550 |
| Profit Margin | 0.15 |
| Operating Margin | 13.34 |
| Return on Assets (ttm) | 3.3 |
| Return on Equity (ttm) | 0.1 |
| Qtrly Rev. Growth | 7.8 |
| Gross Profit (p.s.) | |
| Sales Per Share | 5.348 |
| EBITDA (p.s.) | 1.292 |
| Qtrly Earnings Growth | |
| Operating Cash Flow (M) | 340.10 |
| Levered Free Cash Flow (M) | 325.94 |
| Stock Valuation | |
|---|---|
| PE Ratio | 1247.00 |
| PEG Ratio | |
| Price to Book value | 1.90 |
| Price to Sales | 2.33 |
| Price to Cash Flow | 15.43 |
| Stock Dividends | |
|---|---|
| Dividend | |
| Dividend Yield | |
| Dividend Growth | |