| Avidity Biosciences Inc (RNA) | |||
|---|---|---|---|
| 23.83 -1.26 (-5.02%) | 04-25 16:00 | ||
| Open: | 24.22 | Pre. Close: | 25.09 |
| High: | 24.95 | Low: | 23.35 |
| Volume: | 1,214,921 | Market Cap: | 1,900(M) |
| Stock Technical Analysis | |
|---|---|
| Overall: |  |
| Target: | Six months: 29.59 One year: 32.31 |
| Support: | Support1: 21.56 Support2: 17.94 |
| Resistance: | Resistance1: 25.33 Resistance2: 27.66 |
| Pivot: | 24.38 |
| Moving Averages: | MA(5): 24.19 MA(20): 24.74 MA(100): 15.93 MA(250): 11.57 |
| MACD: | MACD(12,26): 0.54 Signal(12,26,9): 0.83 |
| %K %D: | %K(14,3): 54.56 %D(3): 49.82 |
| RSI: | RSI(14): 51.07 |
| 52-Week: | High: 27.66 Low: 4.825 Change(%): 63.8 |
| Average Vol(K): | 3-Month: 1161 10-Days: 876 |
| Prices Prediction (Update @5:00pm) | ||
|---|---|---|
| If tomorrow: | Open lower | Open higher |
| High: | 24.961 - 25.129 | 25.129 - 25.268 |
| Low: | 23.042 - 23.198 | 23.198 - 23.328 |
| Close: | 23.597 - 23.855 | 23.855 - 24.069 |
| Price, MAs and Bollinger Bands |
|---|
| Price has closed below its short-term moving average. Short-term moving average is currently above mid-term; and above long-term moving average. From the relationship between price and moving averages: This stock is NEUTRAL in short-term; and BULLISH in mid-long term.[ RNA ] has closed above bottom band by 34.7%. Bollinger Bands are 23.3% narrower than normal. The current width of the bands does not suggest anything about the future direction or movement of prices. |
| Company profile |
|---|
| Avidity Biosciences, Inc., a biopharmaceutical company, engages in the development of oligonucleotide-based therapies. It develops antibody oligonucleotide conjugates (AOC) that are designed to treat a range of serious diseases. The company's lead product candidate AOC 1001 is used for the treatment of myotonic dystrophy type 1, a rare monogenic muscle disease; AOC 1044 for the treatment of Duchenne Muscular Dystrophy; and AOC 1020 designed to treat facioscapulohumeral muscular dystrophy which are in preclinical stage. It also offers Lumizyme therapy for Pompe diseases. Avidity Biosciences, Inc. was incorporated in 2012 and is headquartered in San Diego, California. |
| Stock chart |
|---|
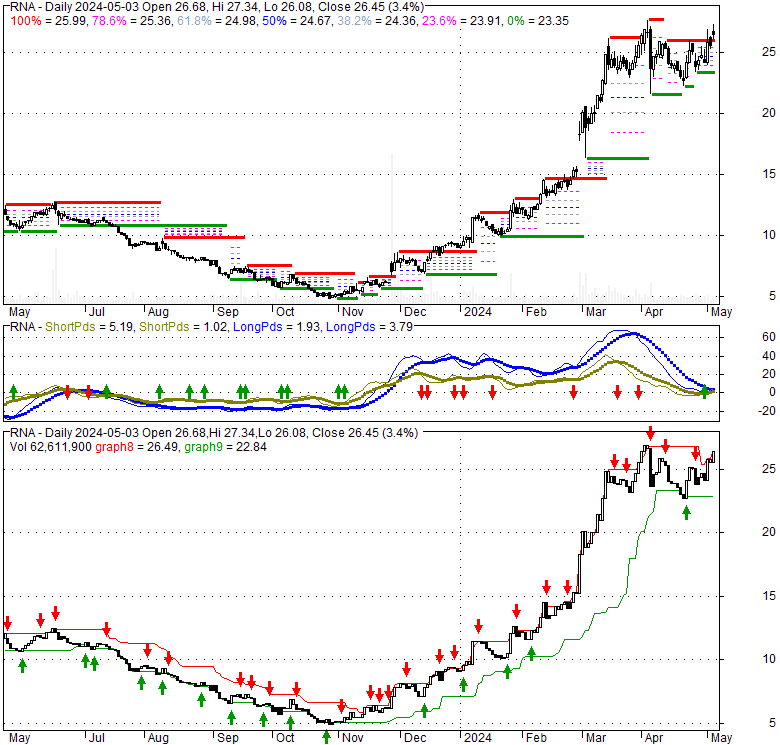 |
| Financial Analysis | |
|---|---|
| Price to Book Value: | Neutral |
| P/BV, a ratio used to compare book value to its current market price, to gauge whether a stock is valued properly. | |
| Price to Earnings: | Underperform |
| PE, the ratio for valuing a company that measures its current share price relative to its earnings per share (EPS). | |
| Discounted cash flow: | Underperform |
| DCF, a valuation method used to estimate the value of an investment based on its expected future cash flows. | |
| Return on Assets: | Underperform |
| ROA, indicates how profitable a company is in relation to its total assets, how efficiently uses assets to generate a profit. | |
| Return on Equity: | Underperform |
| ROE, a measure of financial performance calculated by dividing net income by equity. a gauge of profitability and efficiency. | |
| Debt to Equity: | Neutral |
| evaluate financial leverage, reflects the ability of equity to cover outstanding debts in the event of a business downturn. | |
| Stock Basics & Statistics | |
|---|---|
| Exchange: NASDAQ Global Market | |
| Sector: Healthcare | |
| Industry: Biotechnology | |
| Shares Out. (M) | |
| Shares Float (M) | 79.72 |
| % Held by Insiders | 67970000.00 |
| % Held by Institutions | 6.41 |
| Shares Short (K) | 7770 |
| Shares Short Prior Month (K) | |
| Stock Financials | |
|---|---|
| EPS | -233500000.000 |
| Book Value (p.s.) | |
| Profit Margin | |
| Operating Margin | -3.00 |
| Return on Assets (ttm) | 43.5 |
| Return on Equity (ttm) | -23.2 |
| Qtrly Rev. Growth | 9560000.0 |
| Gross Profit (p.s.) | -27.013 |
| Sales Per Share | -51.091 |
| EBITDA (p.s.) | |
| Qtrly Earnings Growth | -2.91 |
| Operating Cash Flow (M) | |
| Levered Free Cash Flow (M) | -119.06 |
| Stock Valuation | |
|---|---|
| PE Ratio | |
| PEG Ratio | |
| Price to Book value | |
| Price to Sales | -0.47 |
| Price to Cash Flow | 2.90 |
| Stock Dividends | |
|---|---|
| Dividend | |
| Dividend Yield | |
| Dividend Growth | 9980000.000 |


