| Sana Biotechnology Inc (SANA) | |||
|---|---|---|---|
| 9.945 -0.055 (-0.55%) | 05-07 14:01 | ||
| Open: | 10.17 | Pre. Close: | 10 |
| High: | 10.23 | Low: | 9.825 |
| Volume: | 378,841 | Market Cap: | 2,201(M) |
| Stock Technical Analysis | |
|---|---|
| Overall: |  |
| Target: | Six months: 12.26 One year: 14.32 |
| Support: | Support1: 8.49 Support2: 7.25 |
| Resistance: | Resistance1: 10.50 Resistance2: 12.26 |
| Pivot: | 8.89 |
| Moving Averages: | MA(5): 9.97 MA(20): 8.88 MA(100): 7.48 MA(250): 6.00 |
| MACD: | MACD(12,26): 0.30 Signal(12,26,9): 0.10 |
| %K %D: | %K(14,3): 89.32 %D(3): 90.67 |
| RSI: | RSI(14): 60.91 |
| 52-Week: | High: 12 Low: 2.745 Change(%): 63.6 |
| Average Vol(K): | 3-Month: 1968 10-Days: 1717 |
| Prices Prediction (Update @5:00pm) | ||
|---|---|---|
| If tomorrow: | Open lower | Open higher |
| High: | 10.506 - 10.56 | 10.56 - 10.601 |
| Low: | 9.829 - 9.884 | 9.884 - 9.925 |
| Close: | 9.914 - 10.005 | 10.005 - 10.075 |
| Price, MAs and Bollinger Bands |
|---|
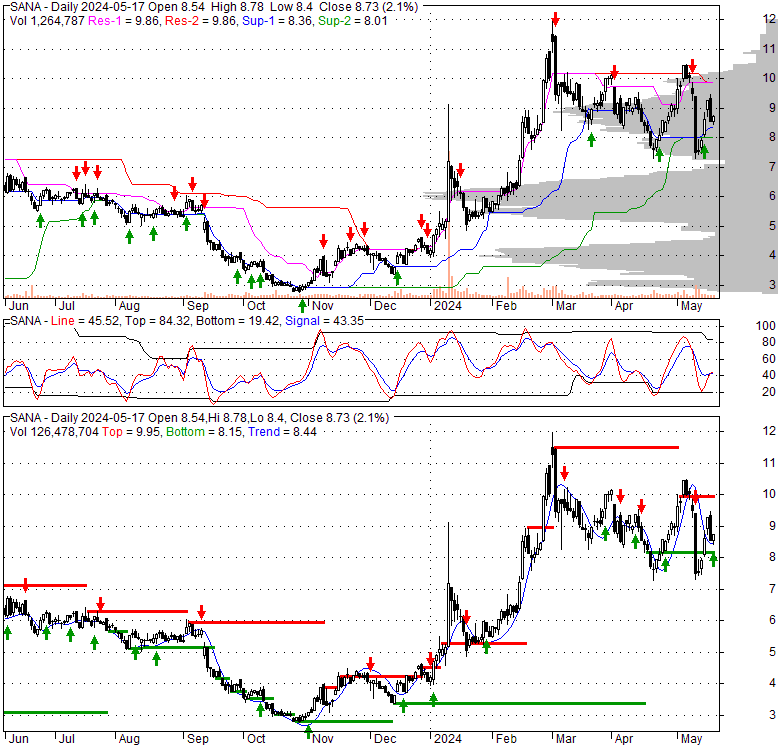
| Price has closed above its short-term moving average. Short-term moving average is currently above mid-term; and above long-term moving average. From the relationship between price and moving averages: This stock is BULLISH in short-term; and BULLISH in mid-long term.[ SANA ] has closed below upper band by 18.4%. Bollinger Bands are 41.3% wider than normal. The large width of the bands suggest high volatility as compared to its normal range. The bands have been in this wide range for 0 days. This is a sign that the current trend might continue. |
| Company profile |
|---|
| Sana Biotechnology, Inc., a biotechnology company, focuses on utilizing engineered cells as medicines. The company develops ex vivo and in vivo cell engineering platforms for various therapeutic areas with unmet treatment needs, including oncology, diabetes, central nervous system disorders, cardiovascular diseases, genetic disorders, and others. Its product candidates include SG295 and SG242 that target CD19+ cancer cells, including non-Hodgkin Lymphoma, chronic lymphocytic leukemia, and acute lymphoblastic leukemia; SG221 and SG239 for the treatment of multiple myeloma; and SG328 for ornithine transcarbamylase deficiency. It also develops SG418 for sickle cell disease and beta-thalassemia; SC291, a CD19 allogeneic T cell therapy; SC255 for multiple myeloma; SC451 for type I diabetes mellitus; and SC379 for secondary progressive multiple sclerosis, Pelizaeus-Merzbacher disease, and Huntington's disease. Sana Biotechnology, Inc. was formerly known as FD Therapeutics, Inc. and changed its name to Sana Biotechnology, Inc. in September 2018. The company was incorporated in 2018 and is headquartered in Seattle, Washington. |
| Stock chart |
|---|
 |
| Financial Analysis | |
|---|---|
| Price to Book Value: | Outperform |
| P/BV, a ratio used to compare book value to its current market price, to gauge whether a stock is valued properly. | |
| Price to Earnings: | Underperform |
| PE, the ratio for valuing a company that measures its current share price relative to its earnings per share (EPS). | |
| Discounted cash flow: | Neutral |
| DCF, a valuation method used to estimate the value of an investment based on its expected future cash flows. | |
| Return on Assets: | Underperform |
| ROA, indicates how profitable a company is in relation to its total assets, how efficiently uses assets to generate a profit. | |
| Return on Equity: | Underperform |
| ROE, a measure of financial performance calculated by dividing net income by equity. a gauge of profitability and efficiency. | |
| Debt to Equity: | Outperform |
| evaluate financial leverage, reflects the ability of equity to cover outstanding debts in the event of a business downturn. | |
| Stock Basics & Statistics | |
|---|---|
| Exchange: NASDAQ Global Select | |
| Sector: Healthcare | |
| Industry: Biotechnology | |
| Shares Out. (M) | 221.32 |
| Shares Float (M) | 129.00 |
| % Held by Insiders | 9.06 |
| % Held by Institutions | 84.63 |
| Shares Short (K) | 26720 |
| Shares Short Prior Month (K) | 24680 |
| Stock Financials | |
|---|---|
| EPS | -1.460 |
| Book Value (p.s.) | 1.450 |
| Profit Margin | |
| Operating Margin | |
| Return on Assets (ttm) | -29.4 |
| Return on Equity (ttm) | -72.0 |
| Qtrly Rev. Growth | |
| Gross Profit (p.s.) | |
| Sales Per Share | |
| EBITDA (p.s.) | -1.366 |
| Qtrly Earnings Growth | |
| Operating Cash Flow (M) | -253.58 |
| Levered Free Cash Flow (M) | -199.92 |
| Stock Valuation | |
|---|---|
| PE Ratio | -6.85 |
| PEG Ratio | |
| Price to Book value | 6.89 |
| Price to Sales | |
| Price to Cash Flow | -8.72 |
| Stock Dividends | |
|---|---|
| Dividend | |
| Dividend Yield | |
| Dividend Growth | |