| Steel Dynamics Inc (STLD) | |||
|---|---|---|---|
| 134.04 1.01 (0.76%) | 04-26 16:00 | ||
| Open: | 133 | Pre. Close: | 133.03 |
| High: | 136.28 | Low: | 133 |
| Volume: | 1,015,892 | Market Cap: | 21,199(M) |
| Stock Technical Analysis | |
|---|---|
| Overall: |  |
| Target: | Six months: 165.93 One year: 176.77 |
| Support: | Support1: 127.05 Support2: 105.71 |
| Resistance: | Resistance1: 142.06 Resistance2: 151.34 |
| Pivot: | 139.01 |
| Moving Averages: | MA(5): 133.69 MA(20): 141.20 MA(100): 127.44 MA(250): 113.45 |
| MACD: | MACD(12,26): -1.58 Signal(12,26,9): 0.02 |
| %K %D: | %K(14,3): 21.01 %D(3): 16.49 |
| RSI: | RSI(14): 40.38 |
| 52-Week: | High: 151.34 Low: 90.55 Change(%): 28.9 |
| Average Vol(K): | 3-Month: 1141 10-Days: 1316 |
| Prices Prediction (Update @5:00pm) | ||
|---|---|---|
| If tomorrow: | Open lower | Open higher |
| High: | 136.407 - 136.931 | 136.931 - 137.534 |
| Low: | 131.573 - 132.136 | 132.136 - 132.783 |
| Close: | 132.994 - 133.897 | 133.897 - 134.934 |
| Price, MAs and Bollinger Bands |
|---|
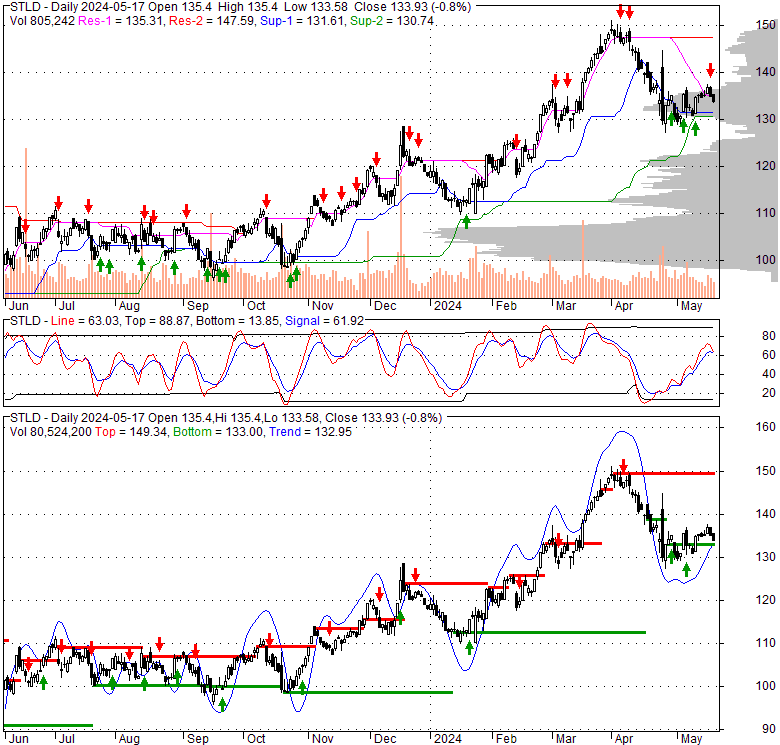
| Price has closed above its short-term moving average. Short-term moving average is currently below mid-term; and above long-term moving average. From the relationship between price and moving averages: This stock is NEUTRAL in short-term; and NEUTRAL in mid-long term.[ STLD ] has closed above bottom band by 25.5%. Bollinger Bands are 49.7% wider than normal. The large width of the bands suggest high volatility as compared to its normal range. The bands have been in this wide range for 2 days. This is a sign that the current trend might continue. |
| Company profile |
|---|
| Steel Dynamics, Inc., together with its subsidiaries, operates as a steel producer and metal recycler in the United States. It operates through three segments: Steel Operations, Metals Recycling Operations, and Steel Fabrication Operations. The Steel Operations segment offers hot roll, cold roll, and coated steel products; parallel flange beams and channel sections, flat bars, large unequal leg angles, and reinforcing bars, as well as standard strength carbon, intermediate alloy hardness, and premium grade rail products; and engineered special-bar-quality products, merchant-bar-quality products, and other engineered round steel bars. The company also engages in turning, polishing, straightening, chamfering, threading, precision saw-cutting, and heat treating of bar products; and cutting to length, straightening, hole punching, shot blasting, welding, galvanizing, and coating of specialty products. Its products are used in construction, automotive, manufacturing, transportation, heavy and agriculture equipment, and pipe and tube markets. This segment sells directly to end-users, steel fabricators, and service centers. The Metals Recycling Operations segment purchases, processes, and resells ferrous and nonferrous scrap metals into reusable forms and grades. Its ferrous products include heavy melting steel, busheling, bundled scrap, shredded scrap, steel turnings, and cast-iron products; and nonferrous products comprise aluminum, brass, copper, stainless steel, and other nonferrous metals. This segment also provides transportation logistics, marketing, brokerage, and scrap management services. The Steel Fabrication Operations segment produces non-residential steel building components, such as steel joists, girders, trusses, and steel deck products. The company also exports its products. Steel Dynamics, Inc. was incorporated in 1993 and is headquartered in Fort Wayne, Indiana. |
| Stock chart |
|---|
 |
| Financial Analysis | |
|---|---|
| Price to Book Value: | Outperform |
| P/BV, a ratio used to compare book value to its current market price, to gauge whether a stock is valued properly. | |
| Price to Earnings: | Outperform |
| PE, the ratio for valuing a company that measures its current share price relative to its earnings per share (EPS). | |
| Discounted cash flow: | Outperform |
| DCF, a valuation method used to estimate the value of an investment based on its expected future cash flows. | |
| Return on Assets: | Outperform |
| ROA, indicates how profitable a company is in relation to its total assets, how efficiently uses assets to generate a profit. | |
| Return on Equity: | Outperform |
| ROE, a measure of financial performance calculated by dividing net income by equity. a gauge of profitability and efficiency. | |
| Debt to Equity: | Outperform |
| evaluate financial leverage, reflects the ability of equity to cover outstanding debts in the event of a business downturn. | |
| Stock Basics & Statistics | |
|---|---|
| Exchange: NASDAQ Global Select | |
| Sector: Basic Materials | |
| Industry: Steel | |
| Shares Out. (M) | 157.95 |
| Shares Float (M) | 147.42 |
| % Held by Insiders | 6.66 |
| % Held by Institutions | 86.88 |
| Shares Short (K) | 4550 |
| Shares Short Prior Month (K) | 4330 |
| Stock Financials | |
|---|---|
| EPS | 14.630 |
| Book Value (p.s.) | 55.410 |
| Profit Margin | 13.04 |
| Operating Margin | 12.25 |
| Return on Assets (ttm) | 13.6 |
| Return on Equity (ttm) | 29.1 |
| Qtrly Rev. Growth | -12.3 |
| Gross Profit (p.s.) | |
| Sales Per Share | 119.025 |
| EBITDA (p.s.) | 22.729 |
| Qtrly Earnings Growth | -27.50 |
| Operating Cash Flow (M) | 3520.00 |
| Levered Free Cash Flow (M) | 1370.00 |
| Stock Valuation | |
|---|---|
| PE Ratio | 9.16 |
| PEG Ratio | -0.76 |
| Price to Book value | 2.42 |
| Price to Sales | 1.13 |
| Price to Cash Flow | 6.01 |
| Stock Dividends | |
|---|---|
| Dividend | |
| Dividend Yield | |
| Dividend Growth | |