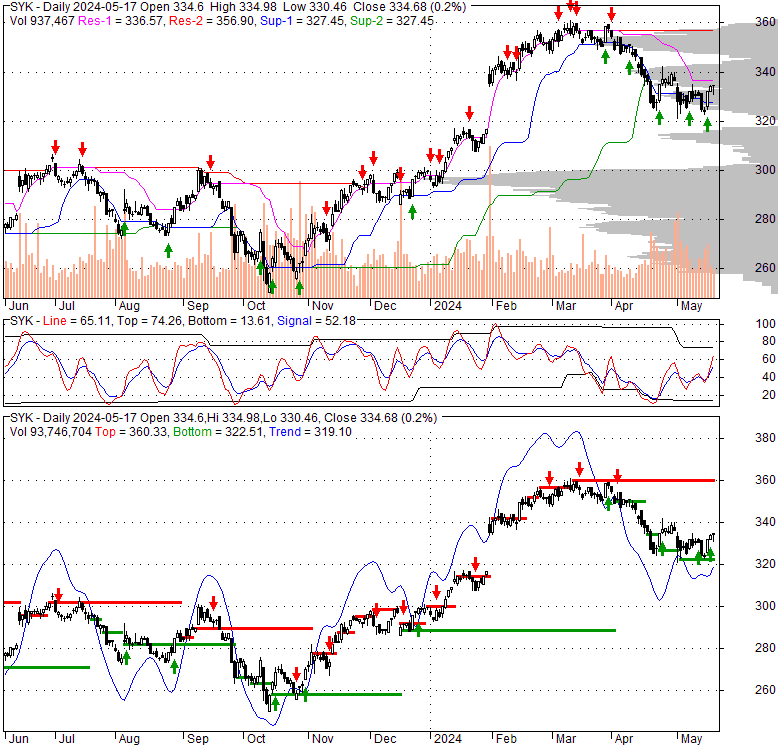
| Stryker Corp (SYK) | |||
|---|---|---|---|
| 328.45 1.82 (0.56%) | 05-03 16:00 | ||
| Open: | 328.65 | Pre. Close: | 326.63 |
| High: | 331.7625 | Low: | 326.701 |
| Volume: | 1,588,856 | Market Cap: | 124,898(M) |
| Stock Technical Analysis | |
|---|---|
| Overall: |  |
| Target: | Six months: 400.89 One year: 417.15 |
| Support: | Support1: 320.71 Support2: 266.83 |
| Resistance: | Resistance1: 343.23 Resistance2: 357.15 |
| Pivot: | 333.10 |
| Moving Averages: | MA(5): 331.71 MA(20): 336.64 MA(100): 331.45 MA(250): 302.50 |
| MACD: | MACD(12,26): -4.67 Signal(12,26,9): -4.19 |
| %K %D: | %K(14,3): 26.36 %D(3): 33.59 |
| RSI: | RSI(14): 37.21 |
| 52-Week: | High: 361.41 Low: 249.98 Change(%): 15.4 |
| Average Vol(K): | 3-Month: 1233 10-Days: 1659 |
| Prices Prediction (Update @5:00pm) | ||
|---|---|---|
| If tomorrow: | Open lower | Open higher |
| High: | 331.916 - 333.92 | 333.92 - 335.841 |
| Low: | 321.94 - 324.309 | 324.309 - 326.579 |
| Close: | 324.837 - 328.309 | 328.309 - 331.636 |
| Price, MAs and Bollinger Bands |
|---|
| Price has closed below its short-term moving average. Short-term moving average is currently below mid-term; and above long-term moving average. From the relationship between price and moving averages: This stock is BEARISH in short-term; and NEUTRAL in mid-long term.[ SYK ] has closed above bottom band by 26.2%. Bollinger Bands are 9.8% narrower than normal. The current width of the bands does not suggest anything about the future direction or movement of prices. |
| Company profile |
|---|
| Stryker Corporation operates as a medical technology company. The company operates through two segments, MedSurg and Neurotechnology, and Orthopaedics and Spine. The Orthopaedics and Spine segment provides implants for use in hip and knee joint replacements, and trauma and extremities surgeries. This segment also offers spinal implant products comprising cervical, thoracolumbar, and interbody systems that are used in spinal injury, deformity, and degenerative therapies. The MedSurg and Neurotechnology segment offers surgical equipment and surgical navigation systems, endoscopic and communications systems, patient handling, emergency medical equipment and intensive care disposable products, reprocessed and remanufactured medical devices, and other medical device products that are used in various medical specialties. This segment also provides neurotechnology products, which include products used for minimally invasive endovascular techniques; products for brain and open skull based surgical procedures; orthobiologic and biosurgery products, such as synthetic bone grafts and vertebral augmentation products; minimally invasive products for the treatment of acute ischemic and hemorrhagic stroke; and craniomaxillofacial implant products, including cranial, maxillofacial, and chest wall devices, as well as dural substitutes and sealants. The company sells its products to doctors, hospitals, and other healthcare facilities through company-owned subsidiaries and branches, as well as third-party dealers and distributors in approximately 75 countries. Stryker Corporation was founded in 1941 and is headquartered in Kalamazoo, Michigan. |
| Stock chart |
|---|
 |
| Financial Analysis | |
|---|---|
| Price to Book Value: | Outperform |
| P/BV, a ratio used to compare book value to its current market price, to gauge whether a stock is valued properly. | |
| Price to Earnings: | Outperform |
| PE, the ratio for valuing a company that measures its current share price relative to its earnings per share (EPS). | |
| Discounted cash flow: | Outperform |
| DCF, a valuation method used to estimate the value of an investment based on its expected future cash flows. | |
| Return on Assets: | Outperform |
| ROA, indicates how profitable a company is in relation to its total assets, how efficiently uses assets to generate a profit. | |
| Return on Equity: | Outperform |
| ROE, a measure of financial performance calculated by dividing net income by equity. a gauge of profitability and efficiency. | |
| Debt to Equity: | Outperform |
| evaluate financial leverage, reflects the ability of equity to cover outstanding debts in the event of a business downturn. | |
| Stock Basics & Statistics | |
|---|---|
| Exchange: New York Stock Exchange | |
| Sector: Healthcare | |
| Industry: Medical - Devices | |
| Shares Out. (M) | 380.47 |
| Shares Float (M) | 340.60 |
| % Held by Insiders | 5.39 |
| % Held by Institutions | 78.83 |
| Shares Short (K) | 4240 |
| Shares Short Prior Month (K) | 3750 |
| Stock Financials | |
|---|---|
| EPS | 8.270 |
| Book Value (p.s.) | 48.920 |
| Profit Margin | 15.44 |
| Operating Margin | 24.47 |
| Return on Assets (ttm) | 6.9 |
| Return on Equity (ttm) | 18.0 |
| Qtrly Rev. Growth | 11.8 |
| Gross Profit (p.s.) | |
| Sales Per Share | 53.881 |
| EBITDA (p.s.) | 13.799 |
| Qtrly Earnings Growth | 102.70 |
| Operating Cash Flow (M) | 3710.00 |
| Levered Free Cash Flow (M) | 2650.00 |
| Stock Valuation | |
|---|---|
| PE Ratio | 39.72 |
| PEG Ratio | 2.48 |
| Price to Book value | 6.71 |
| Price to Sales | 6.09 |
| Price to Cash Flow | 33.68 |
| Stock Dividends | |
|---|---|
| Dividend | |
| Dividend Yield | |
| Dividend Growth | |