| Tenable Holdings Inc (TENB) | |||
|---|---|---|---|
| 45.64 0.11 (0.24%) | 05-07 16:00 | ||
| Open: | 45.5 | Pre. Close: | 45.53 |
| High: | 45.765 | Low: | 44.63 |
| Volume: | 478,982 | Market Cap: | 5,391(M) |
| Stock Technical Analysis | |
|---|---|
| Overall: |  |
| Target: | Six months: 55.24 One year: 58.48 |
| Support: | Support1: 42.80 Support2: 35.61 |
| Resistance: | Resistance1: 47.29 Resistance2: 50.07 |
| Pivot: | 45.26 |
| Moving Averages: | MA(5): 45.20 MA(20): 45.89 MA(100): 46.99 MA(250): 44.32 |
| MACD: | MACD(12,26): -0.60 Signal(12,26,9): -0.63 |
| %K %D: | %K(14,3): 52.57 %D(3): 41.39 |
| RSI: | RSI(14): 46.71 |
| 52-Week: | High: 53.5 Low: 33.85 Change(%): 25.7 |
| Average Vol(K): | 3-Month: 886 10-Days: 839 |
| Prices Prediction (Update @5:00pm) | ||
|---|---|---|
| If tomorrow: | Open lower | Open higher |
| High: | 45.816 - 45.986 | 45.986 - 46.123 |
| Low: | 44.172 - 44.385 | 44.385 - 44.557 |
| Close: | 45.316 - 45.649 | 45.649 - 45.917 |
| Price, MAs and Bollinger Bands |
|---|
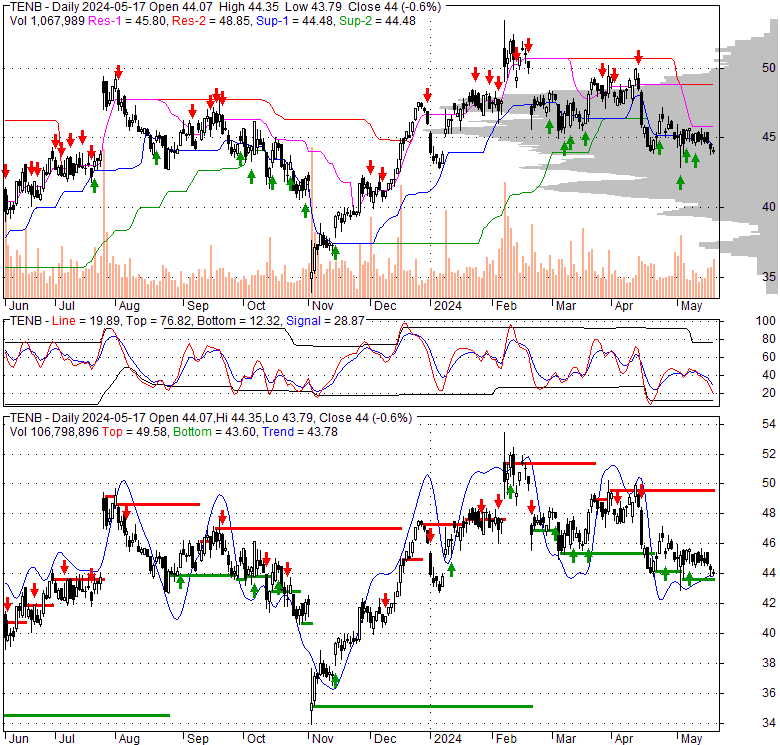
| Price has closed above its short-term moving average. Short-term moving average is currently below mid-term; and below long-term moving average. From the relationship between price and moving averages: This stock is NEUTRAL in short-term; and BEARISH in mid-long term.[ TENB ] has closed below upper band by 35.0%. Bollinger Bands are 52.2% narrower than normal. The narrow width of the bands suggests low volatility as compared to its normal range. The bands have been in this narrow range for 2 bars. This is a sign that the market may be about to initiate a new trend. |
| Company profile |
|---|
| Tenable Holdings, Inc. provides cyber exposure solutions for in the Americas, Europe, the Middle East, Africa, the Asia Pacific, and Japan. Its platforms include Tenable.io, a cloud-delivered software as a service that provides organizations with a risk-based view of traditional and modern attack surfaces; Tenable.cs, a cloud-native application platform that enables organizations to programmatically detect and fix cloud infrastructure misconfigurations; Tenable.io WAS, which provides scanning for modern web applications; and Tenable.ep, an unified platform that helps organizations identify, assess, and accurately prioritize cyber risks across the entire attack surface. The company also offers Tenable.ad, a solution to secure Active Directory environments; Tenable.ot, an on-premises solution that provides threat detection and mitigation, asset tracking, vulnerability management, and configuration control capabilities to protect OT environments, including industrial networks; Tenable.sc, an on-premises solution that provides a risk-based view of an organization's IT, security and compliance posture. In addition, it provides Nessus Professional, a vulnerability assessment solution for identifying security vulnerabilities, configuration issues, and malware; and Nessus Essentials, which includes vulnerability and configuration assessment for a limited number of assets. The company was founded in 2002 and is headquartered in Columbia, Maryland. |
| Stock chart |
|---|
 |
| Financial Analysis | |
|---|---|
| Price to Book Value: | Outperform |
| P/BV, a ratio used to compare book value to its current market price, to gauge whether a stock is valued properly. | |
| Price to Earnings: | Underperform |
| PE, the ratio for valuing a company that measures its current share price relative to its earnings per share (EPS). | |
| Discounted cash flow: | Neutral |
| DCF, a valuation method used to estimate the value of an investment based on its expected future cash flows. | |
| Return on Assets: | Underperform |
| ROA, indicates how profitable a company is in relation to its total assets, how efficiently uses assets to generate a profit. | |
| Return on Equity: | Underperform |
| ROE, a measure of financial performance calculated by dividing net income by equity. a gauge of profitability and efficiency. | |
| Debt to Equity: | Outperform |
| evaluate financial leverage, reflects the ability of equity to cover outstanding debts in the event of a business downturn. | |
| Stock Basics & Statistics | |
|---|---|
| Exchange: NASDAQ Global Select | |
| Sector: Technology | |
| Industry: Software - Infrastructure | |
| Shares Out. (M) | 118.74 |
| Shares Float (M) | 116.76 |
| % Held by Insiders | 1.67 |
| % Held by Institutions | 92.08 |
| Shares Short (K) | 4690 |
| Shares Short Prior Month (K) | 5210 |
| Stock Financials | |
|---|---|
| EPS | -0.580 |
| Book Value (p.s.) | 3.020 |
| Profit Margin | -8.18 |
| Operating Margin | -3.41 |
| Return on Assets (ttm) | -1.1 |
| Return on Equity (ttm) | -20.8 |
| Qtrly Rev. Growth | 14.4 |
| Gross Profit (p.s.) | |
| Sales Per Share | 6.955 |
| EBITDA (p.s.) | 0.021 |
| Qtrly Earnings Growth | |
| Operating Cash Flow (M) | 161.44 |
| Levered Free Cash Flow (M) | 173.98 |
| Stock Valuation | |
|---|---|
| PE Ratio | -78.69 |
| PEG Ratio | 0.92 |
| Price to Book value | 15.11 |
| Price to Sales | 6.56 |
| Price to Cash Flow | 33.57 |
| Stock Dividends | |
|---|---|
| Dividend | |
| Dividend Yield | |
| Dividend Growth | |