| Triumph Group (TGI) | |||
|---|---|---|---|
| 13.66 0.24 (1.79%) | 04-26 16:00 | ||
| Open: | 13.36 | Pre. Close: | 13.42 |
| High: | 13.7 | Low: | 13.3 |
| Volume: | 393,511 | Market Cap: | 1,050(M) |
| Stock Technical Analysis | |
|---|---|
| Overall: |  |
| Target: | Six months: 16.82 One year: 18.07 |
| Support: | Support1: 12.68 Support2: 10.55 |
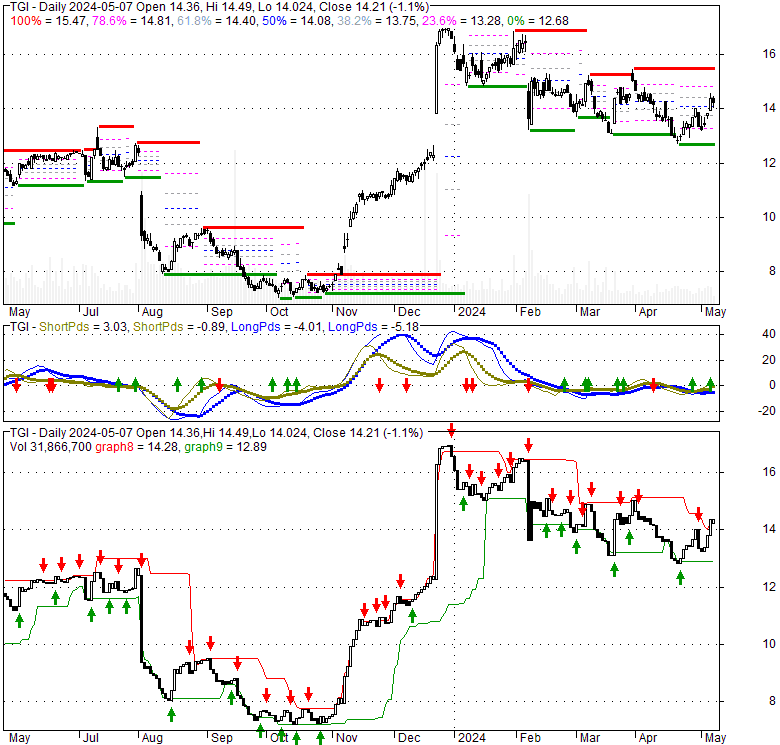
| Resistance: | Resistance1: 14.40 Resistance2: 15.47 |
| Pivot: | 13.48 |
| Moving Averages: | MA(5): 13.37 MA(20): 13.72 MA(100): 14.36 MA(250): 11.74 |
| MACD: | MACD(12,26): -0.25 Signal(12,26,9): -0.27 |
| %K %D: | %K(14,3): 42.01 %D(3): 34.64 |
| RSI: | RSI(14): 48.72 |
| 52-Week: | High: 17.27 Low: 7 Change(%): 26.4 |
| Average Vol(K): | 3-Month: 795 10-Days: 558 |
| Prices Prediction (Update @5:00pm) | ||
|---|---|---|
| If tomorrow: | Open lower | Open higher |
| High: | 13.705 - 13.76 | 13.76 - 13.807 |
| Low: | 13.151 - 13.217 | 13.217 - 13.275 |
| Close: | 13.543 - 13.654 | 13.654 - 13.748 |
| Price, MAs and Bollinger Bands |
|---|
| Price has closed above its short-term moving average. Short-term moving average is currently below mid-term; and below long-term moving average. From the relationship between price and moving averages: This stock is NEUTRAL in short-term; and BEARISH in mid-long term.[ TGI ] has closed below upper band by 39.0%. Bollinger Bands are 41.2% narrower than normal. The narrow width of the bands suggests low volatility as compared to its normal range. The bands have been in this narrow range for 0 bars. This is a sign that the market may be about to initiate a new trend. |
| Company profile |
|---|
| Triumph Group, Inc. designs, engineers, manufactures, repairs, overhauls, and distributes aerostructures, aircraft components, accessories, subassemblies, and systems worldwide. It operates in two segments, Triumph Systems & Support, and Triumph Aerospace Structures. The company offers aircraft and engine-mounted accessory drives, thermal control systems and components, cargo hooks, high lift actuations, cockpit control levers, hydraulic systems and components, control system valve bodies, landing gear actuation systems, electronic engine controls, landing gear components and assemblies, exhaust nozzles and ducting, main engine gearbox assemblies, geared transmissions and drive train components, main fuel pumps, fuel-metering units, primary and secondary flight control systems, and vibration absorbers. It also designs, manufactures, and repairs composite and metal bonding, flight control surfaces, engine nacelles, empennages, wing flaps, acoustic and thermal insulation systems, and composite ducts and floor panels, as well as provides integrated testing and certification services; and fuselage panels, horizontal and vertical tails, and floor grids. In addition, the company offers air cycle machines, blades and vanes, auxiliary power units, constant speed drives, combustors, engine and airframe accessories, stators, flight control surfaces, transition ducts, integrated drive generators, sidewalls, nacelles, light assemblies, remote sensors, overhead bins, thrust reversers, and fuel bladder cells, as well as cabin panes, shades, light lenses, and other components. It serves original equipment manufacturers of commercial, regional, and military aircraft; and aircraft components, as well as business jets and regional airlines, and air cargo carriers. Triumph Group, Inc. was incorporated in 1993 and is headquartered in Berwyn, Pennsylvania. |
| Stock chart |
|---|
 |
| Financial Analysis | |
|---|---|
| Price to Book Value: | Underperform |
| P/BV, a ratio used to compare book value to its current market price, to gauge whether a stock is valued properly. | |
| Price to Earnings: | Underperform |
| PE, the ratio for valuing a company that measures its current share price relative to its earnings per share (EPS). | |
| Discounted cash flow: | Outperform |
| DCF, a valuation method used to estimate the value of an investment based on its expected future cash flows. | |
| Return on Assets: | Underperform |
| ROA, indicates how profitable a company is in relation to its total assets, how efficiently uses assets to generate a profit. | |
| Return on Equity: | Neutral |
| ROE, a measure of financial performance calculated by dividing net income by equity. a gauge of profitability and efficiency. | |
| Debt to Equity: | Underperform |
| evaluate financial leverage, reflects the ability of equity to cover outstanding debts in the event of a business downturn. | |
| Stock Basics & Statistics | |
|---|---|
| Exchange: New York Stock Exchange | |
| Sector: Industrials | |
| Industry: Aerospace & Defense | |
| Shares Out. (M) | 76.87 |
| Shares Float (M) | 69.89 |
| % Held by Insiders | 1.86 |
| % Held by Institutions | 95.26 |
| Shares Short (K) | 5870 |
| Shares Short Prior Month (K) | 4240 |
| Stock Financials | |
|---|---|
| EPS | -0.720 |
| Book Value (p.s.) | -8.720 |
| Profit Margin | -3.76 |
| Operating Margin | 7.22 |
| Return on Assets (ttm) | 5.5 |
| Return on Equity (ttm) | |
| Qtrly Rev. Growth | 8.9 |
| Gross Profit (p.s.) | |
| Sales Per Share | 18.343 |
| EBITDA (p.s.) | 2.324 |
| Qtrly Earnings Growth | |
| Operating Cash Flow (M) | -8.23 |
| Levered Free Cash Flow (M) | -56.25 |
| Stock Valuation | |
|---|---|
| PE Ratio | -18.97 |
| PEG Ratio | -8.09 |
| Price to Book value | -1.57 |
| Price to Sales | 0.74 |
| Price to Cash Flow | -127.59 |
| Stock Dividends | |
|---|---|
| Dividend | |
| Dividend Yield | |
| Dividend Growth | |