| Texas Instruments (TXN) | |||
|---|---|---|---|
| 178.91 3.11 (1.77%) | 05-03 16:00 | ||
| Open: | 177.49 | Pre. Close: | 175.8 |
| High: | 179.68 | Low: | 177.43 |
| Volume: | 4,542,811 | Market Cap: | 162,894(M) |
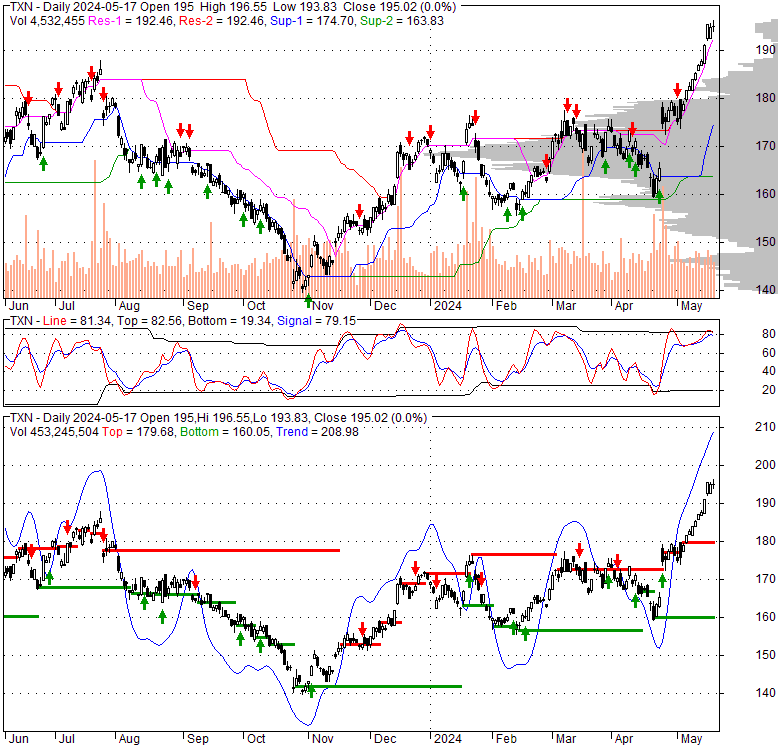
| Stock Technical Analysis | |
|---|---|
| Overall: |  |
| Target: | Six months: 210.02 One year: 245.30 |
| Support: | Support1: 167.02 Support2: 159.11 |
| Resistance: | Resistance1: 179.81 Resistance2: 210.02 |
| Pivot: | 171.00 |
| Moving Averages: | MA(5): 177.12 MA(20): 170.72 MA(100): 167.74 MA(250): 165.80 |
| MACD: | MACD(12,26): 2.23 Signal(12,26,9): 1.14 |
| %K %D: | %K(14,3): 84.69 %D(3): 83.92 |
| RSI: | RSI(14): 61.43 |
| 52-Week: | High: 188.12 Low: 139.48 Change(%): 7.9 |
| Average Vol(K): | 3-Month: 5352 10-Days: 6783 |
| Prices Prediction (Update @5:00pm) | ||
|---|---|---|
| If tomorrow: | Open lower | Open higher |
| High: | 179.847 - 180.538 | 180.538 - 181.333 |
| Low: | 175.526 - 176.277 | 176.277 - 177.141 |
| Close: | 177.515 - 178.719 | 178.719 - 180.103 |
| Price, MAs and Bollinger Bands |
|---|
| Price has closed above its short-term moving average. Short-term moving average is currently above mid-term; and above long-term moving average. From the relationship between price and moving averages: This stock is BULLISH in short-term; and BULLISH in mid-long term.[ TXN ] has closed below upper band by 18.9%. Bollinger Bands are 80.4% wider than normal. The large width of the bands suggest high volatility as compared to its normal range. The bands have been in this wide range for 5 days. This is a sign that the current trend might continue. |
| Company profile |
|---|
| Texas Instruments Incorporated designs, manufactures, and sells semiconductors to electronics designers and manufacturers worldwide. It operates in two segments, Analog and Embedded Processing. The Analog segment offers power products to manage power requirements in various levels using battery-management solutions, DC/DC switching regulators, AC/DC and isolated controllers and converters, power switches, linear regulators, voltage supervisors, voltage references, and lighting products. This segment also provides signal chain products that sense, condition, and measure signals to allow information to be transferred or converted for further processing and control for use in end markets, including amplifiers, data converters, interface products, motor drives, clocks, and sensing products. The Embedded Processing segment offers microcontrollers that are used in electronic equipment; digital signal processors for mathematical computations; and applications processors for specific computing activity. This segment offers products for use in various markets, such as industrial, automotive, personal electronics, communications equipment, enterprise systems, and calculators and other. The company also provides DLP products primarily for use in projectors to create high-definition images; calculators; and application-specific integrated circuits. It markets and sells its semiconductor products through direct sales and distributors, as well as through its website. Texas Instruments Incorporated was founded in 1930 and is headquartered in Dallas, Texas. |
| Stock chart |
|---|
 |
| Financial Analysis | |
|---|---|
| Price to Book Value: | Outperform |
| P/BV, a ratio used to compare book value to its current market price, to gauge whether a stock is valued properly. | |
| Price to Earnings: | Outperform |
| PE, the ratio for valuing a company that measures its current share price relative to its earnings per share (EPS). | |
| Discounted cash flow: | Outperform |
| DCF, a valuation method used to estimate the value of an investment based on its expected future cash flows. | |
| Return on Assets: | Outperform |
| ROA, indicates how profitable a company is in relation to its total assets, how efficiently uses assets to generate a profit. | |
| Return on Equity: | Outperform |
| ROE, a measure of financial performance calculated by dividing net income by equity. a gauge of profitability and efficiency. | |
| Debt to Equity: | Outperform |
| evaluate financial leverage, reflects the ability of equity to cover outstanding debts in the event of a business downturn. | |
| Stock Basics & Statistics | |
|---|---|
| Exchange: NASDAQ Global Select | |
| Sector: Technology | |
| Industry: Semiconductors | |
| Shares Out. (M) | 910.06 |
| Shares Float (M) | 907.11 |
| % Held by Insiders | 0.22 |
| % Held by Institutions | 89.08 |
| Shares Short (K) | 18740 |
| Shares Short Prior Month (K) | 15010 |
| Stock Financials | |
|---|---|
| EPS | 7.070 |
| Book Value (p.s.) | 18.590 |
| Profit Margin | 37.16 |
| Operating Margin | 37.53 |
| Return on Assets (ttm) | 15.4 |
| Return on Equity (ttm) | 41.4 |
| Qtrly Rev. Growth | -12.7 |
| Gross Profit (p.s.) | |
| Sales Per Share | 19.251 |
| EBITDA (p.s.) | 9.329 |
| Qtrly Earnings Growth | -30.20 |
| Operating Cash Flow (M) | 6420.00 |
| Levered Free Cash Flow (M) | -489.75 |
| Stock Valuation | |
|---|---|
| PE Ratio | 25.31 |
| PEG Ratio | 3.23 |
| Price to Book value | 9.62 |
| Price to Sales | 9.29 |
| Price to Cash Flow | 25.36 |
| Stock Dividends | |
|---|---|
| Dividend | |
| Dividend Yield | |
| Dividend Growth | |


