| US Foods Holding (USFD) | |||
|---|---|---|---|
| 52.75 1.35 (2.63%) | 05-06 16:00 | ||
| Open: | 51.81 | Pre. Close: | 51.4 |
| High: | 52.81 | Low: | 51.7925 |
| Volume: | 2,581,020 | Market Cap: | 12,919(M) |
| Stock Technical Analysis | |
|---|---|
| Overall: |  |
| Target: | Six months: 63.17 One year: 73.78 |
| Support: | Support1: 51.34 Support2: 49.65 |
| Resistance: | Resistance1: 54.08 Resistance2: 63.17 |
| Pivot: | 50.87 |
| Moving Averages: | MA(5): 51.22 MA(20): 50.98 MA(100): 49.20 MA(250): 44.32 |
| MACD: | MACD(12,26): -0.09 Signal(12,26,9): -0.28 |
| %K %D: | %K(14,3): 76.35 %D(3): 57.80 |
| RSI: | RSI(14): 59.21 |
| 52-Week: | High: 54.94 Low: 35.66 Change(%): 37.0 |
| Average Vol(K): | 3-Month: 1736 10-Days: 1386 |
| Prices Prediction (Update @5:00pm) | ||
|---|---|---|
| If tomorrow: | Open lower | Open higher |
| High: | 52.815 - 52.999 | 52.999 - 53.168 |
| Low: | 51.257 - 51.495 | 51.495 - 51.714 |
| Close: | 52.37 - 52.704 | 52.704 - 53.01 |
| Price, MAs and Bollinger Bands |
|---|
| Price has closed above its short-term moving average. Short-term moving average is currently below mid-term; and above long-term moving average. From the relationship between price and moving averages: This stock is NEUTRAL in short-term; and NEUTRAL in mid-long term.[ USFD ] has closed Bollinger Bands are 18.8% narrower than normal. The current width of the bands does not suggest anything about the future direction or movement of prices. |
| Company profile |
|---|
| US Foods Holding Corp., through its subsidiary, US Foods, Inc., markets and distributes fresh, frozen, and dry food and non-food products to foodservice customers in the United States. The company's customers include independently owned single and multi-unit restaurants, regional concepts, national restaurant chains, hospitals, nursing homes, hotels and motels, country clubs, government and military organizations, colleges and universities, and retail locations. As of July 06, 2022, it operated 70 broadline facilities; and 80 cash and carry locations. The company was formerly known as USF Holding Corp. and changed its name to US Foods Holding Corp. in February 2016. US Foods Holding Corp. was incorporated in 2007 and is headquartered in Rosemont, Illinois. |
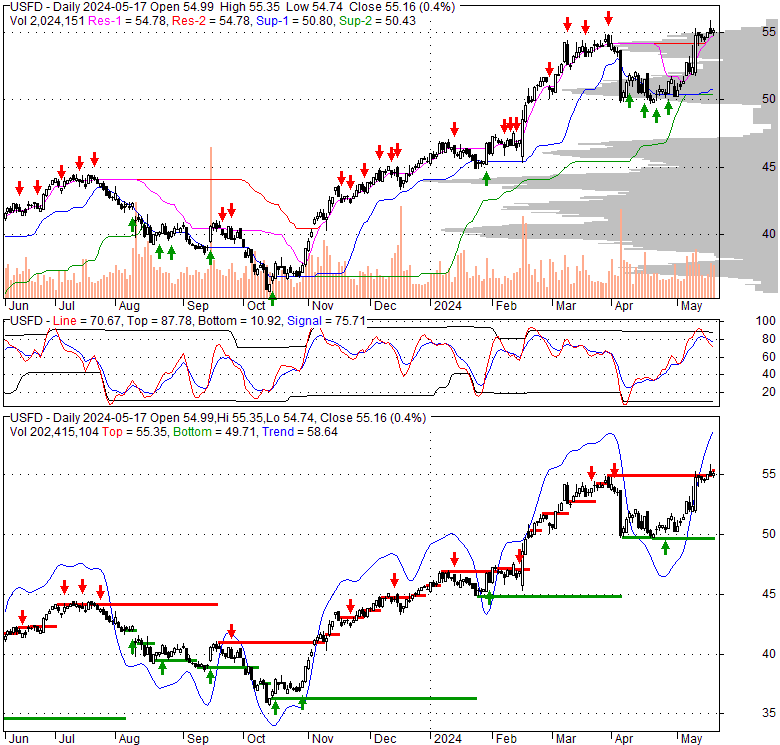
| Stock chart |
|---|
 |
| Financial Analysis | |
|---|---|
| Price to Book Value: | Neutral |
| P/BV, a ratio used to compare book value to its current market price, to gauge whether a stock is valued properly. | |
| Price to Earnings: | Neutral |
| PE, the ratio for valuing a company that measures its current share price relative to its earnings per share (EPS). | |
| Discounted cash flow: | Neutral |
| DCF, a valuation method used to estimate the value of an investment based on its expected future cash flows. | |
| Return on Assets: | Neutral |
| ROA, indicates how profitable a company is in relation to its total assets, how efficiently uses assets to generate a profit. | |
| Return on Equity: | Outperform |
| ROE, a measure of financial performance calculated by dividing net income by equity. a gauge of profitability and efficiency. | |
| Debt to Equity: | Outperform |
| evaluate financial leverage, reflects the ability of equity to cover outstanding debts in the event of a business downturn. | |
| Stock Basics & Statistics | |
|---|---|
| Exchange: New York Stock Exchange | |
| Sector: Consumer Defensive | |
| Industry: Food Distribution | |
| Shares Out. (M) | 245.28 |
| Shares Float (M) | 227.82 |
| % Held by Insiders | 0.37 |
| % Held by Institutions | 101.51 |
| Shares Short (K) | 7220 |
| Shares Short Prior Month (K) | 6750 |
| Stock Financials | |
|---|---|
| EPS | 2.020 |
| Book Value (p.s.) | 19.380 |
| Profit Margin | 1.42 |
| Operating Margin | 3.32 |
| Return on Assets (ttm) | 5.0 |
| Return on Equity (ttm) | 10.9 |
| Qtrly Rev. Growth | 4.9 |
| Gross Profit (p.s.) | |
| Sales Per Share | 145.140 |
| EBITDA (p.s.) | 5.871 |
| Qtrly Earnings Growth | 60.80 |
| Operating Cash Flow (M) | 1140.00 |
| Levered Free Cash Flow (M) | 726.37 |
| Stock Valuation | |
|---|---|
| PE Ratio | 26.11 |
| PEG Ratio | 0.88 |
| Price to Book value | 2.72 |
| Price to Sales | 0.36 |
| Price to Cash Flow | 11.35 |
| Stock Dividends | |
|---|---|
| Dividend | |
| Dividend Yield | |
| Dividend Growth | |