| Vishay Intertechnology (VSH) | |||
|---|---|---|---|
| 22.57 -0.4 (-1.74%) | 05-08 16:00 | ||
| Open: | 22.21 | Pre. Close: | 22.97 |
| High: | 22.99 | Low: | 21.69 |
| Volume: | 2,000,756 | Market Cap: | 3,103(M) |
| Stock Technical Analysis | |
|---|---|
| Overall: |  |
| Target: | Six months: 27.25 One year: 31.83 |
| Support: | Support1: 21.78 Support2: 20.83 |
| Resistance: | Resistance1: 23.33 Resistance2: 27.25 |
| Pivot: | 22.27 |
| Moving Averages: | MA(5): 22.80 MA(20): 22.08 MA(100): 22.42 MA(250): 24.28 |
| MACD: | MACD(12,26): 0.23 Signal(12,26,9): 0.13 |
| %K %D: | %K(14,3): 83.12 %D(3): 84.26 |
| RSI: | RSI(14): 53.19 |
| 52-Week: | High: 30.1 Low: 20.83 Change(%): -8.6 |
| Average Vol(K): | 3-Month: 1367 10-Days: 1413 |
| Prices Prediction (Update @5:00pm) | ||
|---|---|---|
| If tomorrow: | Open lower | Open higher |
| High: | 23.014 - 23.139 | 23.139 - 23.244 |
| Low: | 21.394 - 21.546 | 21.546 - 21.673 |
| Close: | 22.333 - 22.573 | 22.573 - 22.772 |
| Price, MAs and Bollinger Bands |
|---|
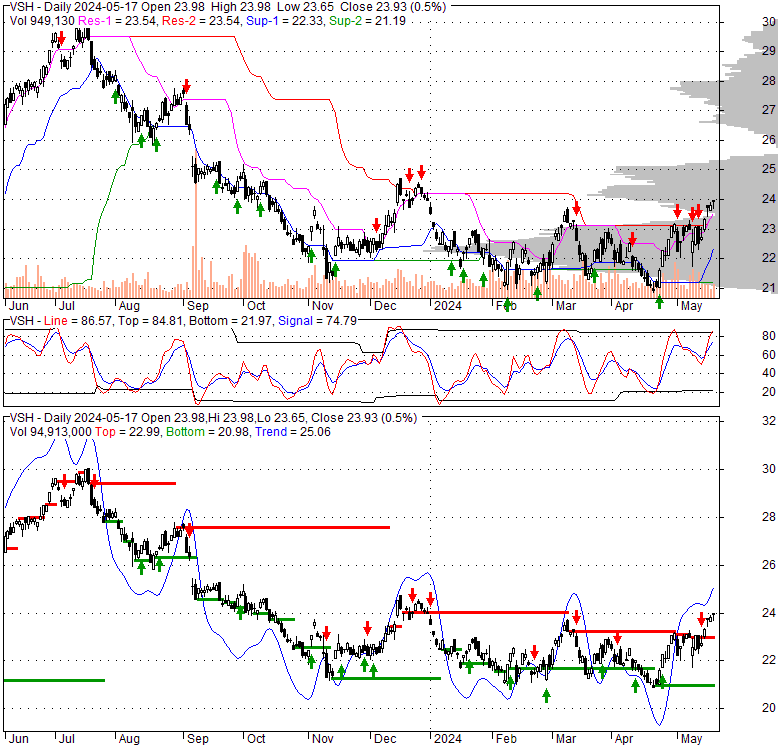
| Price has closed below its short-term moving average. Short-term moving average is currently above mid-term; and above long-term moving average. From the relationship between price and moving averages: This stock is NEUTRAL in short-term; and NEUTRAL in mid-long term.[ VSH ] has closed below upper band by 40.0%. Bollinger Bands are 43% wider than normal. The large width of the bands suggest high volatility as compared to its normal range. The bands have been in this wide range for 6 days. This is a sign that the current trend might continue. |
| Company profile |
|---|
| Vishay Intertechnology, Inc. manufactures and supplies discrete semiconductors and passive electronic components in Asia, Europe, and the Americas. It operates through six segments: Metal Oxide Semiconductor Field Effect Transistors (MOSFETs), Diodes, Optoelectronic Components, Resistors, Inductors, and Capacitors. The MOSFETs segment offers low- and medium-voltage TrenchFET MOSFETs, high-voltage planar MOSFETs, high voltage Super Junction MOSFETs, power integrated circuits, and integrated function power devices. The Diodes segment provides rectifiers, small signal diodes, protection diodes, thyristors/silicon-controlled rectifiers, and power modules. The Optoelectronic Components segment contains standard and customer specific optoelectronic components, such as infrared (IR) emitters and detectors, IR remote control receivers, optocouplers, solid-state relays, optical sensors, light-emitting diodes, 7-segment displays, and IR data transceiver modules. The Resistors segment offers resistors, which are basic components used in various forms of electronic circuitry to adjust and regulate levels of voltage and current. The Inductors segment provides inductors for use as an internal magnetic field to change alternating current phase and resist alternating current. The Capacitors segment offers capacitors, which store energy and discharge it when needed. The company sells its products under Siliconix, Dale, Draloric, Beyschlag, Sfernice, MCB, UltraSource, Applied Thin-Film Products, IHLP, HiRel Systems, Sprague, Vitramon, Barry, Roederstein, ESTA, and BCcomponents brands. It serves industrial, computing, automotive, consumer, telecommunications, power supplies, military, aerospace, and medical end markets. Vishay Intertechnology, Inc. was incorporated in 1962 and is headquartered in Malvern, Pennsylvania. |
| Stock chart |
|---|
 |
| Financial Analysis | |
|---|---|
| Price to Book Value: | Underperform |
| P/BV, a ratio used to compare book value to its current market price, to gauge whether a stock is valued properly. | |
| Price to Earnings: | Outperform |
| PE, the ratio for valuing a company that measures its current share price relative to its earnings per share (EPS). | |
| Discounted cash flow: | Outperform |
| DCF, a valuation method used to estimate the value of an investment based on its expected future cash flows. | |
| Return on Assets: | Outperform |
| ROA, indicates how profitable a company is in relation to its total assets, how efficiently uses assets to generate a profit. | |
| Return on Equity: | Neutral |
| ROE, a measure of financial performance calculated by dividing net income by equity. a gauge of profitability and efficiency. | |
| Debt to Equity: | Outperform |
| evaluate financial leverage, reflects the ability of equity to cover outstanding debts in the event of a business downturn. | |
| Stock Basics & Statistics | |
|---|---|
| Exchange: New York Stock Exchange | |
| Sector: Technology | |
| Industry: Semiconductors | |
| Shares Out. (M) | 125.46 |
| Shares Float (M) | 125.00 |
| % Held by Insiders | 0.45 |
| % Held by Institutions | 103.24 |
| Shares Short (K) | 10670 |
| Shares Short Prior Month (K) | 12120 |
| Stock Financials | |
|---|---|
| EPS | 2.310 |
| Book Value (p.s.) | 15.940 |
| Profit Margin | 9.52 |
| Operating Margin | 9.59 |
| Return on Assets (ttm) | 7.4 |
| Return on Equity (ttm) | 15.3 |
| Qtrly Rev. Growth | -8.2 |
| Gross Profit (p.s.) | |
| Sales Per Share | 27.100 |
| EBITDA (p.s.) | 5.275 |
| Qtrly Earnings Growth | -28.40 |
| Operating Cash Flow (M) | 365.70 |
| Levered Free Cash Flow (M) | 35.10 |
| Stock Valuation | |
|---|---|
| PE Ratio | 9.77 |
| PEG Ratio | -1.35 |
| Price to Book value | 1.42 |
| Price to Sales | 0.83 |
| Price to Cash Flow | 7.74 |
| Stock Dividends | |
|---|---|
| Dividend | |
| Dividend Yield | |
| Dividend Growth | |