| Waters Corp (WAT) | |||
|---|---|---|---|
| 323.8 -2.26 (-0.69%) | 05-08 16:00 | ||
| Open: | 324.87 | Pre. Close: | 326.06 |
| High: | 329.545 | Low: | 323.34 |
| Volume: | 368,233 | Market Cap: | 19,205(M) |
| Stock Technical Analysis | |
|---|---|
| Overall: |  |
| Target: | Six months: 404.76 One year: 472.76 |
| Support: | Support1: 310.94 Support2: 288.94 |
| Resistance: | Resistance1: 346.54 Resistance2: 404.76 |
| Pivot: | 311.96 |
| Moving Averages: | MA(5): 321.31 MA(20): 313.87 MA(100): 326.48 MA(250): 292.04 |
| MACD: | MACD(12,26): -2.56 Signal(12,26,9): -5.28 |
| %K %D: | %K(14,3): 83.14 %D(3): 79.94 |
| RSI: | RSI(14): 52.35 |
| 52-Week: | High: 363.8 Low: 231.9 Change(%): 18.9 |
| Average Vol(K): | 3-Month: 413 10-Days: 480 |
| Prices Prediction (Update @5:00pm) | ||
|---|---|---|
| If tomorrow: | Open lower | Open higher |
| High: | 330.318 - 331.945 | 331.945 - 333.264 |
| Low: | 318.951 - 321.179 | 321.179 - 322.985 |
| Close: | 320.714 - 324.051 | 324.051 - 326.756 |
| Price, MAs and Bollinger Bands |
|---|
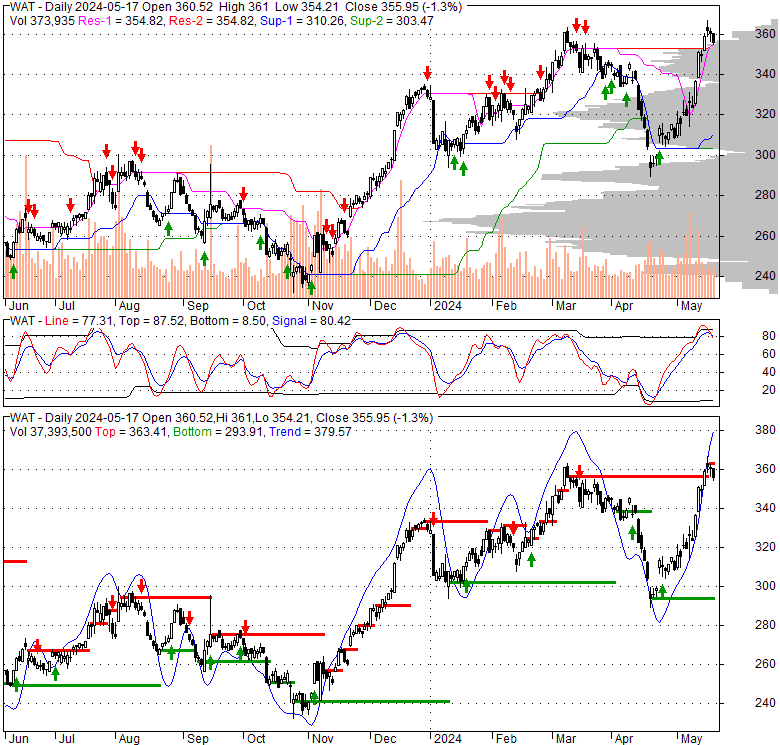
| Price has closed above its short-term moving average. Short-term moving average is currently below mid-term; and below long-term moving average. From the relationship between price and moving averages: This stock is NEUTRAL in short-term; and NEUTRAL in mid-long term.[ WAT ] has closed below upper band by 18.0%. Bollinger Bands are 2.5% wider than normal. The current width of the bands does not suggest anything about the future direction or movement of prices. |
| Company profile |
|---|
| Waters Corporation, a specialty measurement company, provides analytical workflow solutions in Asia, the Americas, and Europe. It operates through two segments, Waters and TA. The company designs, manufactures, sells, and services high and ultra-performance liquid chromatography, as well as mass spectrometry (MS) technology systems and support products, including chromatography columns, other consumable products, and post-warranty service plans. It also designs, manufactures, sells, and services thermal analysis, rheometry, and calorimetry instruments; and develops and supplies software-based products that interface with its instruments, as well as other manufacturers' instruments. Its MS technology instruments are used in drug discovery and development comprising clinical trial testing, the analysis of proteins in disease processes, nutritional safety analysis, and environmental testing. The company offers thermal analysis, rheometry, and calorimetry instruments for use in predicting the suitability and stability of fine chemicals, pharmaceuticals, water, polymers, metals, and viscous liquids for various industrial, consumer good, and healthcare products, as well as for life science research. Its products are used by life science, pharmaceutical, biochemical, industrial, nutritional safety, environmental, academic, and governmental customers working in research and development, quality assurance, and other laboratory applications. Waters Corporation was founded in 1958 and is headquartered in Milford, Massachusetts. |
| Stock chart |
|---|
 |
| Financial Analysis | |
|---|---|
| Price to Book Value: | Outperform |
| P/BV, a ratio used to compare book value to its current market price, to gauge whether a stock is valued properly. | |
| Price to Earnings: | Outperform |
| PE, the ratio for valuing a company that measures its current share price relative to its earnings per share (EPS). | |
| Discounted cash flow: | Outperform |
| DCF, a valuation method used to estimate the value of an investment based on its expected future cash flows. | |
| Return on Assets: | Outperform |
| ROA, indicates how profitable a company is in relation to its total assets, how efficiently uses assets to generate a profit. | |
| Return on Equity: | Outperform |
| ROE, a measure of financial performance calculated by dividing net income by equity. a gauge of profitability and efficiency. | |
| Debt to Equity: | Outperform |
| evaluate financial leverage, reflects the ability of equity to cover outstanding debts in the event of a business downturn. | |
| Stock Basics & Statistics | |
|---|---|
| Exchange: New York Stock Exchange | |
| Sector: Healthcare | |
| Industry: Medical - Diagnostics & Research | |
| Shares Out. (M) | 59.31 |
| Shares Float (M) | 59.05 |
| % Held by Insiders | 0.05 |
| % Held by Institutions | 101.44 |
| Shares Short (K) | 3940 |
| Shares Short Prior Month (K) | 3920 |
| Stock Financials | |
|---|---|
| EPS | 10.830 |
| Book Value (p.s.) | 19.440 |
| Profit Margin | 21.72 |
| Operating Margin | 36.96 |
| Return on Assets (ttm) | 13.5 |
| Return on Equity (ttm) | 77.6 |
| Qtrly Rev. Growth | -4.5 |
| Gross Profit (p.s.) | |
| Sales Per Share | 49.907 |
| EBITDA (p.s.) | 17.198 |
| Qtrly Earnings Growth | -4.20 |
| Operating Cash Flow (M) | 602.81 |
| Levered Free Cash Flow (M) | 443.64 |
| Stock Valuation | |
|---|---|
| PE Ratio | 29.90 |
| PEG Ratio | 5.27 |
| Price to Book value | 16.66 |
| Price to Sales | 6.49 |
| Price to Cash Flow | 31.86 |
| Stock Dividends | |
|---|---|
| Dividend | |
| Dividend Yield | |
| Dividend Growth | |