| Weibo Corp ADR (WB) | |||
|---|---|---|---|
| 9.82 -0.14 (-1.41%) | 05-07 16:00 | ||
| Open: | 9.67 | Pre. Close: | 9.96 |
| High: | 9.82 | Low: | 9.575 |
| Volume: | 1,231,914 | Market Cap: | 2,443(M) |
| Stock Technical Analysis | |
|---|---|
| Overall: |  |
| Target: | Six months: 11.96 One year: 13.97 |
| Support: | Support1: 8.60 Support2: 7.58 |
| Resistance: | Resistance1: 10.24 Resistance2: 11.96 |
| Pivot: | 8.70 |
| Moving Averages: | MA(5): 9.47 MA(20): 8.53 MA(100): 9.12 MA(250): 11.52 |
| MACD: | MACD(12,26): 0.22 Signal(12,26,9): |
| %K %D: | %K(14,3): 89.30 %D(3): 90.39 |
| RSI: | RSI(14): 64.48 |
| 52-Week: | High: 17.67 Low: 7.58 Change(%): -37.1 |
| Average Vol(K): | 3-Month: 2366 10-Days: 1987 |
| Prices Prediction (Update @5:00pm) | ||
|---|---|---|
| If tomorrow: | Open lower | Open higher |
| High: | 9.826 - 9.876 | 9.876 - 9.914 |
| Low: | 9.454 - 9.506 | 9.506 - 9.546 |
| Close: | 9.736 - 9.825 | 9.825 - 9.894 |
| Price, MAs and Bollinger Bands |
|---|
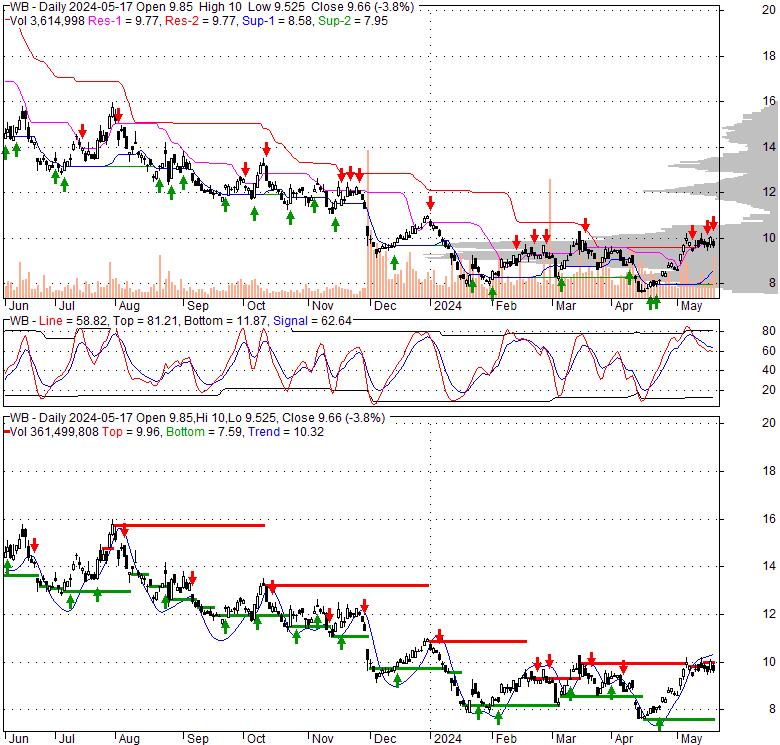
| Price has closed above its short-term moving average. Short-term moving average is currently above mid-term; and above long-term moving average. From the relationship between price and moving averages: This stock is BULLISH in short-term; and NEUTRAL in mid-long term.[ WB ] has closed below upper band by 8.9%. Bollinger Bands are 50.2% wider than normal. The large width of the bands suggest high volatility as compared to its normal range. The bands have been in this wide range for 1 days. This is a sign that the current trend might continue. |
| Company profile |
|---|
| Weibo Corporation, through its subsidiaries, operates as a social media platform for people to create, distribute, and discover content in the People's Republic of China. It operates in two segments, Advertising and Marketing Services; and Value-Added Services. The company offers discovery products to help users discover content on its platform; self-expression products that enable its users to express themselves on its platform; and social products to promote social interaction between users on its platform. It also provides advertising and marketing solutions, such as social display advertisements; and promoted marketing offerings, such as Fans Headline and Weibo Express, as well as promoted trends and search products that appear alongside user's trends discovery and search behaviors. In addition, the company offers products, such as trends, search, video/live streaming, and editing tools; content customization, copyright contents pooling, and user interaction development; and search list recommendation, trends list recommendation, and Weibo app opening advertisements. Further, it provides back-end management, traffic support, and product solutions to MCNs, unions, and e-commerce partners; open application platform for other app developers that allows users to log into third-party applications with their Weibo account for sharing third-party content on its platform; and Weibo Wallet, a product that enables platform partners to conduct interest generation activities on Weibo, such as handing out red envelops and coupons. The company was formerly known as T.CN Corporation and changed its name to Weibo Corporation in 2012. The company was founded in 2009 and is headquartered in Beijing, China. Weibo Corporation is a subsidiary of Sina Corporation. |
| Stock chart |
|---|
 |
| Financial Analysis | |
|---|---|
| Price to Book Value: | Underperform |
| P/BV, a ratio used to compare book value to its current market price, to gauge whether a stock is valued properly. | |
| Price to Earnings: | Neutral |
| PE, the ratio for valuing a company that measures its current share price relative to its earnings per share (EPS). | |
| Discounted cash flow: | Outperform |
| DCF, a valuation method used to estimate the value of an investment based on its expected future cash flows. | |
| Return on Assets: | Outperform |
| ROA, indicates how profitable a company is in relation to its total assets, how efficiently uses assets to generate a profit. | |
| Return on Equity: | Outperform |
| ROE, a measure of financial performance calculated by dividing net income by equity. a gauge of profitability and efficiency. | |
| Debt to Equity: | Outperform |
| evaluate financial leverage, reflects the ability of equity to cover outstanding debts in the event of a business downturn. | |
| Stock Basics & Statistics | |
|---|---|
| Exchange: NASDAQ Global Select | |
| Sector: Communication Services | |
| Industry: Internet Content & Information | |
| Shares Out. (M) | 243.32 |
| Shares Float (M) | 84.24 |
| % Held by Insiders | 6.14 |
| % Held by Institutions | 43.06 |
| Shares Short (K) | 10740 |
| Shares Short Prior Month (K) | 10900 |
| Stock Financials | |
|---|---|
| EPS | 1.430 |
| Book Value (p.s.) | 14.010 |
| Profit Margin | 19.47 |
| Operating Margin | 25.67 |
| Return on Assets (ttm) | 4.1 |
| Return on Equity (ttm) | 10.4 |
| Qtrly Rev. Growth | 3.5 |
| Gross Profit (p.s.) | |
| Sales Per Share | 7.233 |
| EBITDA (p.s.) | 2.184 |
| Qtrly Earnings Growth | -42.50 |
| Operating Cash Flow (M) | 672.82 |
| Levered Free Cash Flow (M) | 236.89 |
| Stock Valuation | |
|---|---|
| PE Ratio | 6.87 |
| PEG Ratio | 1.26 |
| Price to Book value | 0.70 |
| Price to Sales | 1.36 |
| Price to Cash Flow | 3.55 |
| Stock Dividends | |
|---|---|
| Dividend | |
| Dividend Yield | |
| Dividend Growth | |