| Waitr Holdings Inc (WTRH) | |||
|---|---|---|---|
| 0.0931 -0.006 (-5.96%) | 11-22 00:00 | ||
| Open: | 0.105 | Pre. Close: | 0.099 |
| High: | 0.105 | Low: | 0.0924 |
| Volume: | 4,481,683 | Market Cap: | 1(M) |
| Stock Technical Analysis | |
|---|---|
| Overall: |  |
| Target: | Six months: 0.88 One year: 1.02 |
| Support: | Support1: 0.47 Support2: 0.30 |
| Resistance: | Resistance1: 0.75 Resistance2: 0.88 |
| Pivot: | 0.42 |
| Moving Averages: | MA(5): 0.50 MA(20): 0.43 MA(100): 2.36 MA(250): 4.85 |
| MACD: | MACD(12,26): -0.14 Signal(12,26,9): -0.22 |
| %K %D: | %K(14,3): 92.00 %D(3): 74.73 |
| RSI: | RSI(14): 54.39 |
| 52-Week: | High: 22 Low: 0.0924 Change(%): -94.2 |
| Average Vol(K): | 3-Month: 678 10-Days: 817 |
| Prices Prediction (Update @5:00pm) | ||
|---|---|---|
| If tomorrow: | Open lower | Open higher |
| High: | 0.751 - 0.754 | 0.754 - 0.757 |
| Low: | 0.484 - 0.487 | 0.487 - 0.489 |
| Close: | 0.713 - 0.72 | 0.72 - 0.726 |
| Price, MAs and Bollinger Bands |
|---|
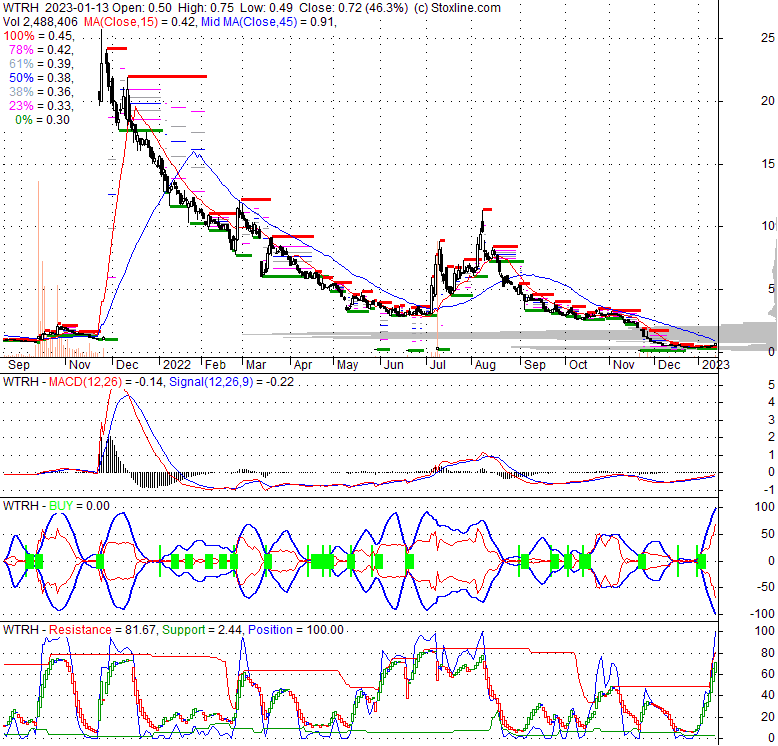
| Price has closed above its short-term moving average. Short-term moving average is currently below mid-term; and below long-term moving average. From the relationship between price and moving averages: This stock is NEUTRAL in short-term; and BEARISH in mid-long term.[ WTRH ] has closed above the upper band by 29.6%. If price is in a uptrend band; this upward trend in price might continue. However a short term pullback inside the band is likely.Bollinger Bands are 77% narrower than normal. The narrow width of the bands suggests low volatility as compared to its normal range. The bands have been in this narrow range for 21 bars. This is a sign that the market may be about to initiate a new trend. |
| Company profile |
|---|
| ASAP, Inc. operates an online ordering technology platform in the United States. Its platform allows to order food, alcohol, convenience, grocery, flowers, auto parts, and others. The company's platform also facilitates access to third parties that provide payment processing solutions for restaurants and other merchants. As of June 30, 2022, it had approximately 27,000 restaurants in approximately 1,000 cities. The company was formerly known as Waitr Holdings Inc. and changed its name to ASAP, Inc. in August 2022. ASAP, Inc. was founded in 2013 and is headquartered in Lafayette, Louisiana. |
| Stock chart |
|---|
 |
| Financial Analysis | |
|---|---|
| Price to Book Value: | Neutral |
| P/BV, a ratio used to compare book value to its current market price, to gauge whether a stock is valued properly. | |
| Price to Earnings: | Neutral |
| PE, the ratio for valuing a company that measures its current share price relative to its earnings per share (EPS). | |
| Discounted cash flow: | Outperform |
| DCF, a valuation method used to estimate the value of an investment based on its expected future cash flows. | |
| Return on Assets: | Underperform |
| ROA, indicates how profitable a company is in relation to its total assets, how efficiently uses assets to generate a profit. | |
| Return on Equity: | Underperform |
| ROE, a measure of financial performance calculated by dividing net income by equity. a gauge of profitability and efficiency. | |
| Debt to Equity: | Outperform |
| evaluate financial leverage, reflects the ability of equity to cover outstanding debts in the event of a business downturn. | |
| Stock Basics & Statistics | |
|---|---|
| Exchange: NASDAQ Global Select | |
| Sector: Technology | |
| Industry: Software - Application | |
| Shares Out. (M) | 207.82 |
| Shares Float (M) | 167.56 |
| % Held by Insiders | 10.07 |
| % Held by Institutions | 22.29 |
| Shares Short (K) | 16930 |
| Shares Short Prior Month (K) | 14780 |
| Stock Financials | |
|---|---|
| EPS | -0.601 |
| Book Value (p.s.) | 0.020 |
| Profit Margin | -131.13 |
| Operating Margin | -23.35 |
| Return on Assets (ttm) | -11.5 |
| Return on Equity (ttm) | -280.3 |
| Qtrly Rev. Growth | -42.1 |
| Gross Profit (p.s.) | 0.354 |
| Sales Per Share | 0.626 |
| EBITDA (p.s.) | -0.083 |
| Qtrly Earnings Growth | |
| Operating Cash Flow (M) | -23.47 |
| Levered Free Cash Flow (M) | -15.96 |
| Stock Valuation | |
|---|---|
| PE Ratio | -1.20 |
| PEG Ratio | -0.02 |
| Price to Book value | 35.94 |
| Price to Sales | 1.15 |
| Price to Cash Flow | -6.36 |
| Stock Dividends | |
|---|---|
| Dividend | |
| Dividend Yield | |
| Dividend Growth | |


