| United States Steel Corp (X) | |||
|---|---|---|---|
| 37.42 0.25 (0.67%) | 04-26 16:00 | ||
| Open: | 37 | Pre. Close: | 37.17 |
| High: | 37.9025 | Low: | 36.73 |
| Volume: | 3,221,917 | Market Cap: | 8,413(M) |
| Stock Technical Analysis | |
|---|---|
| Overall: |  |
| Target: | Six months: 46.93 One year: 49.83 |
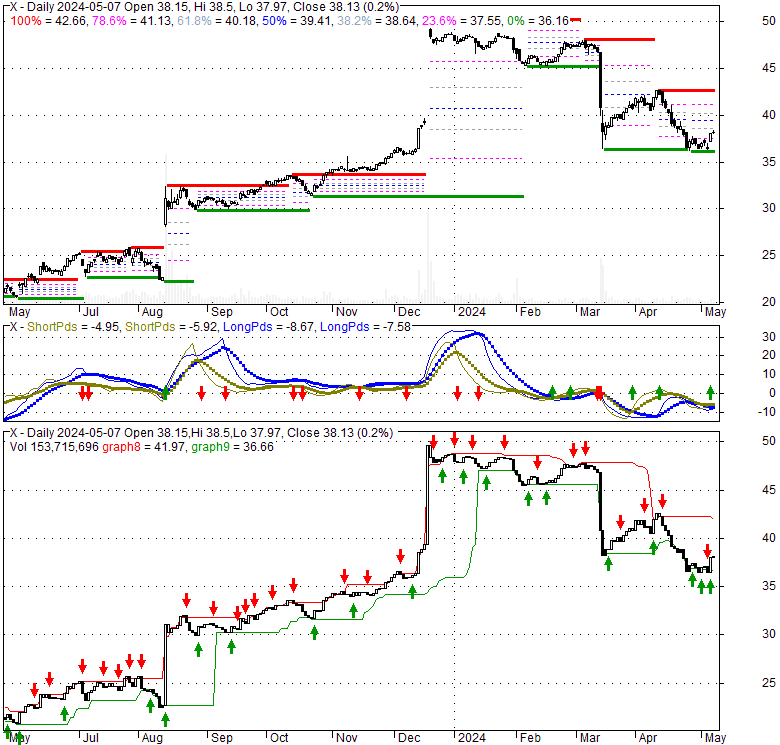
| Support: | Support1: 36.16 Support2: 30.09 |
| Resistance: | Resistance1: 40.18 Resistance2: 42.66 |
| Pivot: | 39.63 |
| Moving Averages: | MA(5): 37.59 MA(20): 40.09 MA(100): 43.99 MA(250): 34.46 |
| MACD: | MACD(12,26): -1.39 Signal(12,26,9): -1.14 |
| %K %D: | %K(14,3): 12.79 %D(3): 9.48 |
| RSI: | RSI(14): 33.04 |
| 52-Week: | High: 50.2 Low: 20.4 Change(%): 63.5 |
| Average Vol(K): | 3-Month: 4566 10-Days: 3490 |
| Prices Prediction (Update @5:00pm) | ||
|---|---|---|
| If tomorrow: | Open lower | Open higher |
| High: | 37.935 - 38.081 | 38.081 - 38.249 |
| Low: | 36.336 - 36.491 | 36.491 - 36.67 |
| Close: | 37.128 - 37.38 | 37.38 - 37.67 |
| Price, MAs and Bollinger Bands |
|---|
| Price has closed below its short-term moving average. Short-term moving average is currently below mid-term; and below long-term moving average. From the relationship between price and moving averages: This stock is BEARISH in short-term; and BEARISH in mid-long term.[ X ] has closed above bottom band by 20.4%. Bollinger Bands are 11.8% wider than normal. The current width of the bands does not suggest anything about the future direction or movement of prices. |
| Company profile |
|---|
| United States Steel Corporation produces and sells flat-rolled and tubular steel products primarily in North America and Europe. It operates through four segments: North American Flat-Rolled (Flat-Rolled), Mini Mill, U. S. Steel Europe (USSE), and Tubular Products (Tubular). The Flat-Rolled segment offers slabs, strip mill plates, sheets, and tin mill products, as well as iron ore and coke. This segment serves customers in the service center, conversion, transportation, automotive, construction, container, appliance, and electrical markets. The Mini Mill segment provides hot-rolled, cold-rolled, and coated sheets and electrical products. This segment serves customers in the automotive, appliance, construction, container, transportation, and service center markets. The USSE segment provides slabs, strip mill plates, sheets, tin mill products, and spiral welded pipes. This segment serves customers in the construction, container, appliance and electrical, service center, conversion, oil, gas, and petrochemical markets. The Tubular segment offers seamless and electric resistance welded steel casing and tubing products, as well as standard and line pipe and mechanical tubing products primarily to customers in the oil, gas, and petrochemical markets. The company also engages in the real estate business. United States Steel Corporation was founded in 1901 and is headquartered in Pittsburgh, Pennsylvania. |
| Stock chart |
|---|
 |
| Financial Analysis | |
|---|---|
| Price to Book Value: | Neutral |
| P/BV, a ratio used to compare book value to its current market price, to gauge whether a stock is valued properly. | |
| Price to Earnings: | Underperform |
| PE, the ratio for valuing a company that measures its current share price relative to its earnings per share (EPS). | |
| Discounted cash flow: | Outperform |
| DCF, a valuation method used to estimate the value of an investment based on its expected future cash flows. | |
| Return on Assets: | Outperform |
| ROA, indicates how profitable a company is in relation to its total assets, how efficiently uses assets to generate a profit. | |
| Return on Equity: | Neutral |
| ROE, a measure of financial performance calculated by dividing net income by equity. a gauge of profitability and efficiency. | |
| Debt to Equity: | Outperform |
| evaluate financial leverage, reflects the ability of equity to cover outstanding debts in the event of a business downturn. | |
| Stock Basics & Statistics | |
|---|---|
| Exchange: New York Stock Exchange | |
| Sector: Basic Materials | |
| Industry: Steel | |
| Shares Out. (M) | 224.82 |
| Shares Float (M) | 221.57 |
| % Held by Insiders | 1.47 |
| % Held by Institutions | 84.08 |
| Shares Short (K) | 19690 |
| Shares Short Prior Month (K) | 18960 |
| Stock Financials | |
|---|---|
| EPS | 3.560 |
| Book Value (p.s.) | 49.390 |
| Profit Margin | 4.96 |
| Operating Margin | -2.44 |
| Return on Assets (ttm) | 3.1 |
| Return on Equity (ttm) | 8.4 |
| Qtrly Rev. Growth | -4.5 |
| Gross Profit (p.s.) | |
| Sales Per Share | 80.286 |
| EBITDA (p.s.) | 8.540 |
| Qtrly Earnings Growth | |
| Operating Cash Flow (M) | 2100.00 |
| Levered Free Cash Flow (M) | -750.75 |
| Stock Valuation | |
|---|---|
| PE Ratio | 10.51 |
| PEG Ratio | 1.47 |
| Price to Book value | 0.76 |
| Price to Sales | 0.47 |
| Price to Cash Flow | 4.01 |
| Stock Dividends | |
|---|---|
| Dividend | |
| Dividend Yield | |
| Dividend Growth | |