| 111 Inc ADR (YI) | |||
|---|---|---|---|
| 1.15 0.03 (2.68%) | 05-03 16:00 | ||
| Open: | 1.13 | Pre. Close: | 1.12 |
| High: | 1.18 | Low: | 1.13 |
| Volume: | 41,743 | Market Cap: | 90(M) |
| Stock Technical Analysis | |
|---|---|
| Overall: |  |
| Target: | Six months: 1.45 One year: 1.69 |
| Support: | Support1: 1.07 Support2: 0.97 |
| Resistance: | Resistance1: 1.24 Resistance2: 1.45 |
| Pivot: | 1.04 |
| Moving Averages: | MA(5): 1.09 MA(20): 1.06 MA(100): 1.35 MA(250): 2.09 |
| MACD: | MACD(12,26): -0.03 Signal(12,26,9): -0.05 |
| %K %D: | %K(14,3): 73.15 %D(3): 56.06 |
| RSI: | RSI(14): 54.09 |
| 52-Week: | High: 3.36 Low: 0.97 Change(%): -58.0 |
| Average Vol(K): | 3-Month: 62 10-Days: 20 |
| Prices Prediction (Update @5:00pm) | ||
|---|---|---|
| If tomorrow: | Open lower | Open higher |
| High: | 1.181 - 1.186 | 1.186 - 1.191 |
| Low: | 1.118 - 1.124 | 1.124 - 1.129 |
| Close: | 1.141 - 1.15 | 1.15 - 1.158 |
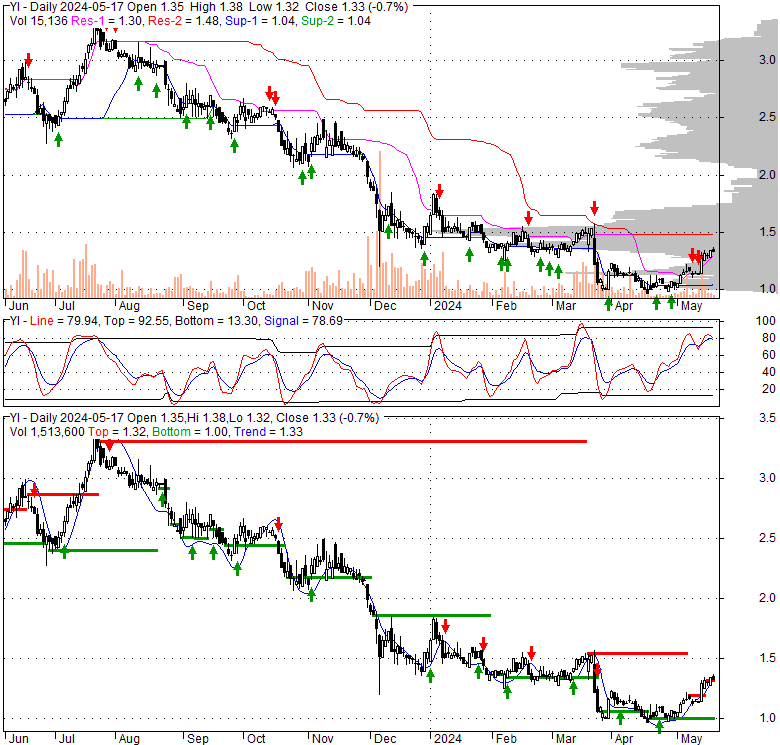
| Price, MAs and Bollinger Bands |
|---|
| Price has closed above its short-term moving average. Short-term moving average is currently below mid-term; and below long-term moving average. From the relationship between price and moving averages: This stock is NEUTRAL in short-term; and BEARISH in mid-long term.[ YI ] has closed above the upper band by 7.1%. If price is in a uptrend band; this upward trend in price might continue. However a short term pullback inside the band is likely.Bollinger Bands are 50.1% narrower than normal. The narrow width of the bands suggests low volatility as compared to its normal range. The bands have been in this narrow range for 8 bars. This is a sign that the market may be about to initiate a new trend. |
| Company profile |
|---|
| 111, Inc. operates an integrated online and offline platform in the healthcare market in the People's Republic of China. It operates through two segments, B2B and B2C. The company sells medical and wellness products through online retail, and wholesale and retail pharmacies, as well as provides value-added services that include online consultation services and electronic prescription services to consumers. It offers prescription and over-the counter drugs, including western and traditional Chinese medicines; nutritional supplements, such as vitamins and dietary products; contact lenses; medical supplies and devices comprising bandages and thermometers; and personal care products consisting of skin care, birth control, and sexual wellness products; and baby products. The company also operates an online marketplace where third-party sellers can directly sell to pharmacies; provides online loan application services to the clients of 1 Pharmacy, which include pharmacies and wholesalers; and data and supply chain integration services. As of December 31, 2021, it operated 14 offline retail pharmacies under the Yi Hao Pharmacy brand name in Guangzhou, Tianjin, Kunshan, Chongqing, and Wuhan provinces. In addition, the company offers warehousing, logistics, procurement, research and development, and consulting services; and software development and information technology support services. It serves pharmacies, pharmaceutical companies and distributors, medical professionals, and insurance companies. The company was formerly known as New Peak Group and changed its name to 111, Inc. in April 2018. 111, Inc. was founded in 2010 and is headquartered in Shanghai, the People's Republic of China. |
| Stock chart |
|---|
 |
| Stock News |
|---|
|
Fri, 26 Apr 2024 111, Inc. (NASDAQ:YI) Short Interest Update - MarketBeat Fri, 26 Apr 2024 111, Inc. (NASDAQ:YI) Short Interest Update - Defense World Mon, 04 Mar 2024 YI Stock Quote Price and Forecast - CNN Thu, 05 May 2022 HFCAA News: 128 Chinese Stocks the SEC Could Delist - InvestorPlace Thu, 05 May 2022 HFCAA News: 128 Chinese Stocks the SEC Could Delist - Markets Insider Fri, 03 May 2024 |
| Financial Analysis | |
|---|---|
| Price to Book Value: | Underperform |
| P/BV, a ratio used to compare book value to its current market price, to gauge whether a stock is valued properly. | |
| Price to Earnings: | Underperform |
| PE, the ratio for valuing a company that measures its current share price relative to its earnings per share (EPS). | |
| Discounted cash flow: | Outperform |
| DCF, a valuation method used to estimate the value of an investment based on its expected future cash flows. | |
| Return on Assets: | Underperform |
| ROA, indicates how profitable a company is in relation to its total assets, how efficiently uses assets to generate a profit. | |
| Return on Equity: | Outperform |
| ROE, a measure of financial performance calculated by dividing net income by equity. a gauge of profitability and efficiency. | |
| Debt to Equity: | Underperform |
| evaluate financial leverage, reflects the ability of equity to cover outstanding debts in the event of a business downturn. | |
| Stock Basics & Statistics | |
|---|---|
| Exchange: NASDAQ Global Market | |
| Sector: Healthcare | |
| Industry: Medical - Pharmaceuticals | |
| Shares Out. (M) | 83.99 |
| Shares Float (M) | 65.94 |
| % Held by Insiders | 16.72 |
| % Held by Institutions | 28.28 |
| Shares Short (K) | 30 |
| Shares Short Prior Month (K) | 42 |
| Stock Financials | |
|---|---|
| EPS | -0.490 |
| Book Value (p.s.) | -6.870 |
| Profit Margin | -2.63 |
| Operating Margin | -5.03 |
| Return on Assets (ttm) | -6.7 |
| Return on Equity (ttm) | -79.0 |
| Qtrly Rev. Growth | |
| Gross Profit (p.s.) | |
| Sales Per Share | 177.997 |
| EBITDA (p.s.) | -3.682 |
| Qtrly Earnings Growth | |
| Operating Cash Flow (M) | -447.24 |
| Levered Free Cash Flow (M) | 177.15 |
| Stock Valuation | |
|---|---|
| PE Ratio | -2.35 |
| PEG Ratio | |
| Price to Book value | -0.17 |
| Price to Sales | 0.01 |
| Price to Cash Flow | -0.22 |
| Stock Dividends | |
|---|---|
| Dividend | |
| Dividend Yield | |
| Dividend Growth | |


