| Full Truck Alliance Ltd ADR (YMM) | |||
|---|---|---|---|
| 8.55 -0.12 (-1.38%) | 05-08 16:00 | ||
| Open: | 8.61 | Pre. Close: | 8.67 |
| High: | 8.64 | Low: | 8.43 |
| Volume: | 5,478,869 | Market Cap: | 8,997(M) |
| Stock Technical Analysis | |
|---|---|
| Overall: |  |
| Target: | Six months: 10.52 One year: 12.29 |
| Support: | Support1: 7.97 Support2: 7.32 |
| Resistance: | Resistance1: 9.01 Resistance2: 10.52 |
| Pivot: | 8.44 |
| Moving Averages: | MA(5): 8.74 MA(20): 8.26 MA(100): 7.08 MA(250): 6.92 |
| MACD: | MACD(12,26): 0.34 Signal(12,26,9): 0.35 |
| %K %D: | %K(14,3): 76.70 %D(3): 83.10 |
| RSI: | RSI(14): 60.74 |
| 52-Week: | High: 9.01 Low: 5.41 Change(%): 47.7 |
| Average Vol(K): | 3-Month: 8234 10-Days: 7831 |
| Prices Prediction (Update @5:00pm) | ||
|---|---|---|
| If tomorrow: | Open lower | Open higher |
| High: | 8.658 - 8.71 | 8.71 - 8.749 |
| Low: | 8.316 - 8.385 | 8.385 - 8.436 |
| Close: | 8.459 - 8.561 | 8.561 - 8.637 |
| Price, MAs and Bollinger Bands |
|---|
| Price has closed below its short-term moving average. Short-term moving average is currently above mid-term; and above long-term moving average. From the relationship between price and moving averages: This stock is NEUTRAL in short-term; and BULLISH in mid-long term.[ YMM ] has closed below upper band by 43.0%. Bollinger Bands are 65.6% wider than normal. The large width of the bands suggest high volatility as compared to its normal range. The bands have been in this wide range for 8 days. This is a sign that the current trend might continue. |
| Company profile |
|---|
| Full Truck Alliance Co. Ltd., together with its subsidiaries, operates a digital freight platform that connects shippers with truckers to facilitate shipments across distance ranges, cargo weights, and types in the People's Republic of China. The company offers freight listing, matching, and brokerage services; and online transaction services, as well as various value-added services, such as credit solutions, insurance brokerage, electronic toll collection, and energy services. It also provides technology development and other services. The company was founded in 2011 and is based in Guiyang, China. |
| Stock chart |
|---|
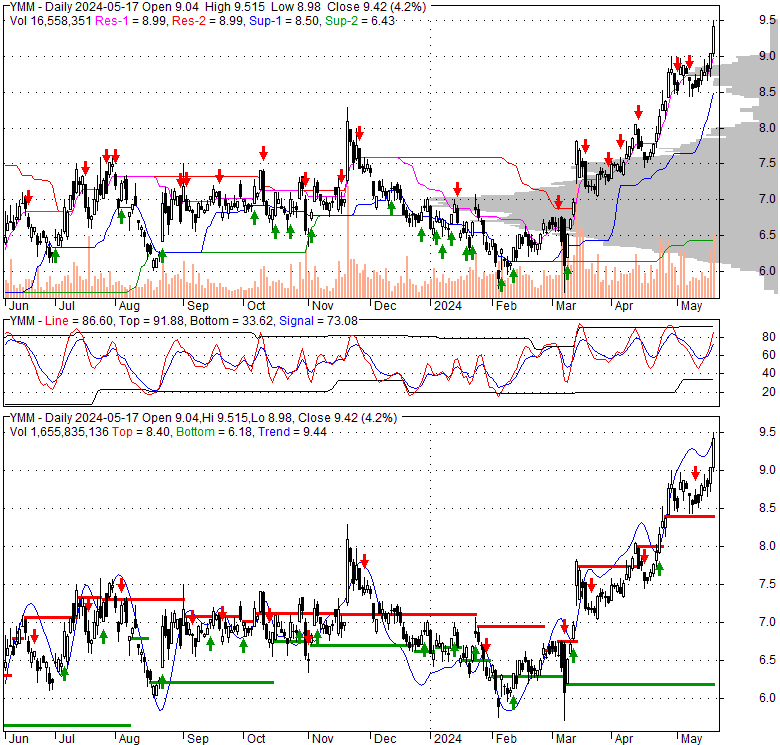 |
| Financial Analysis | |
|---|---|
| Price to Book Value: | Underperform |
| P/BV, a ratio used to compare book value to its current market price, to gauge whether a stock is valued properly. | |
| Price to Earnings: | Outperform |
| PE, the ratio for valuing a company that measures its current share price relative to its earnings per share (EPS). | |
| Discounted cash flow: | Neutral |
| DCF, a valuation method used to estimate the value of an investment based on its expected future cash flows. | |
| Return on Assets: | Outperform |
| ROA, indicates how profitable a company is in relation to its total assets, how efficiently uses assets to generate a profit. | |
| Return on Equity: | Neutral |
| ROE, a measure of financial performance calculated by dividing net income by equity. a gauge of profitability and efficiency. | |
| Debt to Equity: | Underperform |
| evaluate financial leverage, reflects the ability of equity to cover outstanding debts in the event of a business downturn. | |
| Stock Basics & Statistics | |
|---|---|
| Exchange: New York Stock Exchange | |
| Sector: Technology | |
| Industry: Software - Application | |
| Shares Out. (M) | 1050.00 |
| Shares Float (M) | 13590.00 |
| % Held by Insiders | 0.27 |
| % Held by Institutions | 51.43 |
| Shares Short (K) | 44910 |
| Shares Short Prior Month (K) | 37470 |
| Stock Financials | |
|---|---|
| EPS | 0.280 |
| Book Value (p.s.) | 34.070 |
| Profit Margin | 26.23 |
| Operating Margin | 9.88 |
| Return on Assets (ttm) | 1.8 |
| Return on Equity (ttm) | 6.4 |
| Qtrly Rev. Growth | 25.3 |
| Gross Profit (p.s.) | |
| Sales Per Share | 8.038 |
| EBITDA (p.s.) | 1.086 |
| Qtrly Earnings Growth | 118.70 |
| Operating Cash Flow (M) | 2270.00 |
| Levered Free Cash Flow (M) | 704.16 |
| Stock Valuation | |
|---|---|
| PE Ratio | 30.54 |
| PEG Ratio | 0.54 |
| Price to Book value | 0.25 |
| Price to Sales | 1.06 |
| Price to Cash Flow | 3.95 |
| Stock Dividends | |
|---|---|
| Dividend | |
| Dividend Yield | |
| Dividend Growth | |


