| Yield10 Bioscience Inc (YTEN) | |||
|---|---|---|---|
| 0.2218 -0.017 (-7.2%) | 04-26 16:00 | ||
| Open: | 0.249 | Pre. Close: | 0.239 |
| High: | 0.249 | Low: | 0.216 |
| Volume: | 326,281 | Market Cap: | 3(M) |
| Stock Technical Analysis | |
|---|---|
| Overall: |  |
| Target: | Six months: 0.42 One year: 0.53 |
| Support: | Support1: 0.21 Support2: 0.18 |
| Resistance: | Resistance1: 0.36 Resistance2: 0.45 |
| Pivot: | 0.29 |
| Moving Averages: | MA(5): 0.24 MA(20): 0.30 MA(100): 0.26 MA(250): 0.87 |
| MACD: | MACD(12,26): -0.02 Signal(12,26,9): -0.01 |
| %K %D: | %K(14,3): 9.48 %D(3): 12.77 |
| RSI: | RSI(14): 37.94 |
| 52-Week: | High: 3.29 Low: 0.18 Change(%): -92.2 |
| Average Vol(K): | 3-Month: 5311 10-Days: 398 |
| Prices Prediction (Update @5:00pm) | ||
|---|---|---|
| If tomorrow: | Open lower | Open higher |
| High: | 0.25 - 0.252 | 0.252 - 0.253 |
| Low: | 0.217 - 0.218 | 0.218 - 0.22 |
| Close: | 0.217 - 0.22 | 0.22 - 0.222 |
| Price, MAs and Bollinger Bands |
|---|
| Price has closed below its short-term moving average. Short-term moving average is currently below mid-term; and below long-term moving average. From the relationship between price and moving averages: This stock is BEARISH in short-term; and NEUTRAL in mid-long term.[ YTEN ] has closed above bottom band by 14.9%. Bollinger Bands are 39.3% wider than normal. The current width of the bands does not suggest anything about the future direction or movement of prices. |
| Company profile |
|---|
| Yield10 Bioscience, Inc., an agricultural bioscience company, engages in developing technologies to enable step-change increases in crop yield in the United States and Canada. The company, through its Trait Factory, a trait gene discovery platform develops enhanced oilseed Camelina sativa for the production of proprietary seed products; and discovers high value genetic traits for the agriculture and food industries. Yield10 Bioscience, Inc. has license agreements with GDM Seeds; J. R. Simplot; Forage Genetics International, LLC; and Bayer AG. The company was formerly known as Metabolix, Inc. and changed its name to Yield10 Bioscience, Inc. in January 2017. Yield10 Bioscience, Inc. was incorporate in 1992 and is headquartered in Woburn, Massachusetts. |
| Stock chart |
|---|
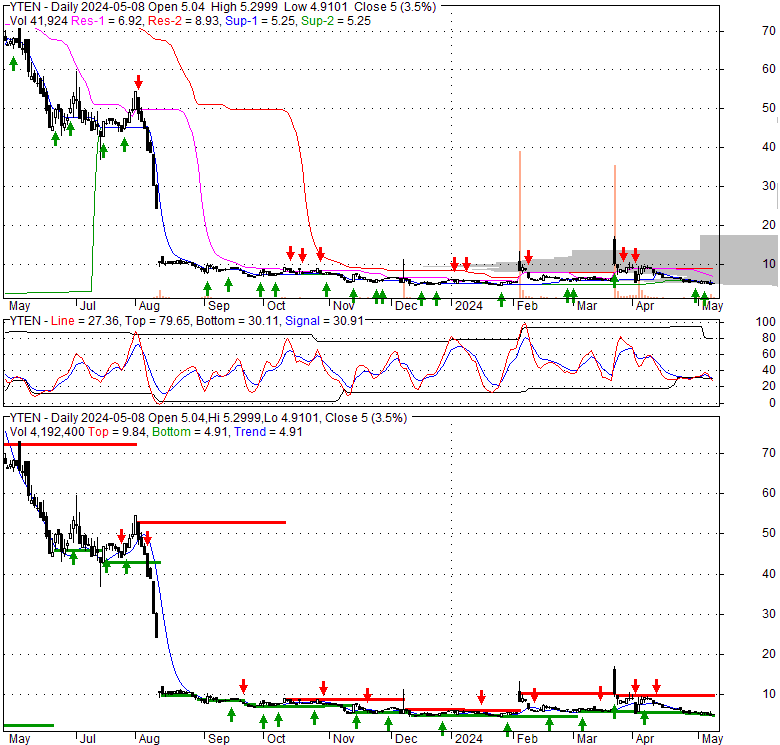 |
| Financial Analysis | |
|---|---|
| Price to Book Value: | Underperform |
| P/BV, a ratio used to compare book value to its current market price, to gauge whether a stock is valued properly. | |
| Price to Earnings: | Outperform |
| PE, the ratio for valuing a company that measures its current share price relative to its earnings per share (EPS). | |
| Discounted cash flow: | Underperform |
| DCF, a valuation method used to estimate the value of an investment based on its expected future cash flows. | |
| Return on Assets: | Underperform |
| ROA, indicates how profitable a company is in relation to its total assets, how efficiently uses assets to generate a profit. | |
| Return on Equity: | Outperform |
| ROE, a measure of financial performance calculated by dividing net income by equity. a gauge of profitability and efficiency. | |
| Debt to Equity: | Underperform |
| evaluate financial leverage, reflects the ability of equity to cover outstanding debts in the event of a business downturn. | |
| Stock Basics & Statistics | |
|---|---|
| Exchange: NASDAQ Capital Market | |
| Sector: Basic Materials | |
| Industry: Agricultural Inputs | |
| Shares Out. (M) | -4.57 |
| Shares Float (M) | |
| % Held by Insiders | 15400000.00 |
| % Held by Institutions | 14210000.00 |
| Shares Short (K) | |
| Shares Short Prior Month (K) | |
| Stock Financials | |
|---|---|
| EPS | |
| Book Value (p.s.) | -1.820 |
| Profit Margin | |
| Operating Margin | -24.00 |
| Return on Assets (ttm) | 28.3 |
| Return on Equity (ttm) | -150.3 |
| Qtrly Rev. Growth | 508.1 |
| Gross Profit (p.s.) | |
| Sales Per Share | -250.507 |
| EBITDA (p.s.) | |
| Qtrly Earnings Growth | -14130000.00 |
| Operating Cash Flow (M) | |
| Levered Free Cash Flow (M) | |
| Stock Valuation | |
|---|---|
| PE Ratio | |
| PEG Ratio | |
| Price to Book value | -0.12 |
| Price to Sales | |
| Price to Cash Flow | |
| Stock Dividends | |
|---|---|
| Dividend | 940870.000 |
| Dividend Yield | 4241975.00 |
| Dividend Growth | 290520.000 |


