| Yum China Holdings Inc (YUMC) | |||
|---|---|---|---|
| 38.41 1.05 (2.81%) | 05-03 16:00 | ||
| Open: | 38.02 | Pre. Close: | 37.36 |
| High: | 38.56 | Low: | 37.95 |
| Volume: | 2,621,748 | Market Cap: | 15,393(M) |
| Stock Technical Analysis | |
|---|---|
| Overall: |  |
| Target: | Six months: 47.65 One year: 55.65 |
| Support: | Support1: 37.78 Support2: 35.92 |
| Resistance: | Resistance1: 40.79 Resistance2: 47.65 |
| Pivot: | 37.81 |
| Moving Averages: | MA(5): 37.65 MA(20): 37.96 MA(100): 39.38 MA(250): 48.24 |
| MACD: | MACD(12,26): -0.42 Signal(12,26,9): -0.46 |
| %K %D: | %K(14,3): 29.14 %D(3): 25.52 |
| RSI: | RSI(14): 50.06 |
| 52-Week: | High: 63.09 Low: 33.55 Change(%): -38.6 |
| Average Vol(K): | 3-Month: 3143 10-Days: 3622 |
| Prices Prediction (Update @5:00pm) | ||
|---|---|---|
| If tomorrow: | Open lower | Open higher |
| High: | 38.596 - 38.744 | 38.744 - 38.915 |
| Low: | 37.543 - 37.703 | 37.703 - 37.888 |
| Close: | 38.11 - 38.369 | 38.369 - 38.666 |
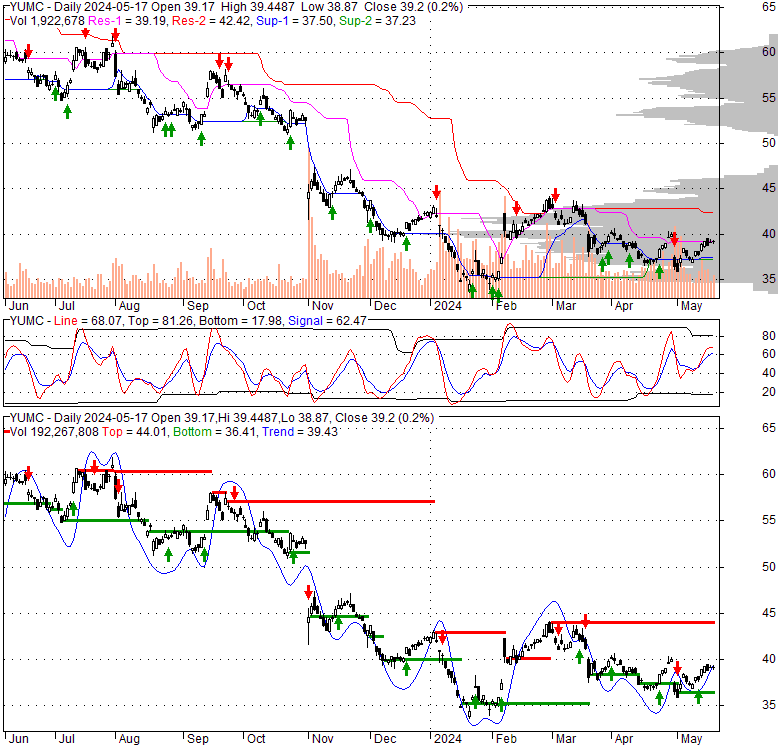
| Price, MAs and Bollinger Bands |
|---|
| Price has closed above its short-term moving average. Short-term moving average is currently below mid-term; and below long-term moving average. From the relationship between price and moving averages: This stock is NEUTRAL in short-term; and BEARISH in mid-long term.[ YUMC ] has closed below upper band by 37.0%. Bollinger Bands are 16.1% narrower than normal. The current width of the bands does not suggest anything about the future direction or movement of prices. |
| Company profile |
|---|
| Yum China Holdings, Inc. owns, operates, and franchises restaurants in China. The company operates through two segments, KFC and Pizza Hut. It operates restaurants under the KFC, Pizza Hut, Little Sheep, Huang Ji Huang, Lavazza, COFFii & JOY, Taco Bell, and East Dawning brands, which specialize in chicken, pizza, hot pot cooking, simmer pot, Italian coffee, specialty coffee, Mexican-style food, and Chinese food categories. The company also operates V-Gold Mall, a mobile e-commerce platform, which sells electronics, home and kitchen accessories, and other general merchandise, as well as fried rice, steak, pasta and other ready meals, and coffee capsules. In addition, it operates franchise restaurants under the KFC, Pizza Hut, Huang Ji Huang, Taco Bell, Little Sheep, East Dawning, Lavazza, and COFFii & JOY names. As of March 31, 2022, the company operated 12,117 restaurants in approximately 1,700 cities. Yum China Holdings, Inc. was incorporated in 2016 and is headquartered in Shanghai, China. |
| Stock chart |
|---|
 |
| Financial Analysis | |
|---|---|
| Price to Book Value: | Outperform |
| P/BV, a ratio used to compare book value to its current market price, to gauge whether a stock is valued properly. | |
| Price to Earnings: | Neutral |
| PE, the ratio for valuing a company that measures its current share price relative to its earnings per share (EPS). | |
| Discounted cash flow: | Outperform |
| DCF, a valuation method used to estimate the value of an investment based on its expected future cash flows. | |
| Return on Assets: | Outperform |
| ROA, indicates how profitable a company is in relation to its total assets, how efficiently uses assets to generate a profit. | |
| Return on Equity: | Outperform |
| ROE, a measure of financial performance calculated by dividing net income by equity. a gauge of profitability and efficiency. | |
| Debt to Equity: | Neutral |
| evaluate financial leverage, reflects the ability of equity to cover outstanding debts in the event of a business downturn. | |
| Stock Basics & Statistics | |
|---|---|
| Exchange: New York Stock Exchange | |
| Sector: Consumer Cyclical | |
| Industry: Restaurants | |
| Shares Out. (M) | 390.82 |
| Shares Float (M) | 371.33 |
| % Held by Insiders | 0.29 |
| % Held by Institutions | 89.11 |
| Shares Short (K) | 12210 |
| Shares Short Prior Month (K) | 9140 |
| Stock Financials | |
|---|---|
| EPS | 1.970 |
| Book Value (p.s.) | 15.740 |
| Profit Margin | 7.53 |
| Operating Margin | 4.81 |
| Return on Assets (ttm) | 5.9 |
| Return on Equity (ttm) | 12.6 |
| Qtrly Rev. Growth | 19.4 |
| Gross Profit (p.s.) | |
| Sales Per Share | 28.095 |
| EBITDA (p.s.) | 4.068 |
| Qtrly Earnings Growth | 99.30 |
| Operating Cash Flow (M) | 1470.00 |
| Levered Free Cash Flow (M) | 583.88 |
| Stock Valuation | |
|---|---|
| PE Ratio | 19.50 |
| PEG Ratio | 0.53 |
| Price to Book value | 2.44 |
| Price to Sales | 1.37 |
| Price to Cash Flow | 10.21 |
| Stock Dividends | |
|---|---|
| Dividend | |
| Dividend Yield | |
| Dividend Growth | |


